There are three widely-used methods for identifying the sections of a latent variable line that correspond to each category of a rating scale (or other ordered polytomy) for an item. For well-behaved rating scales, the three methods produce similar results, so the choice of method depends on what best communicates the findings to the audience. Each method has advantages and disadvantages.
Rasch-Andrich Thresholds: which of two adjacent categories is more likely to be observed?
Imagine a 7 category rating scale, scored 1-7: very strongly disagree VSD, strongly disagree SD, disagree D, neutral N, agree A, strongly agree SA, and very strongly agree VSA. This item is in an instrument administered to 900 persons. For this item, the observed frequencies of each category are: VSD 100, SD 0, D 100, N 50, A 200, SA 350, VSA 200. Notice that SD, strongly disagree, is not observed for this item in this data set. When this data set is analyzed using Masters' Rasch Partial Credit Model (PCM), a response structure for our item is estimated.
|
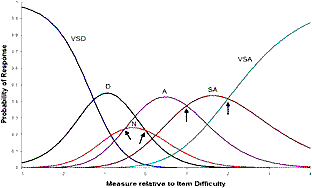
| Figure 1. Modeled category probability curves |
The PCM category probability curves are shown in Figure 1. There are 6 curves visible. Starting from the left, VSD is most likely to be observed for low-measure respondents. Then as respondent measures increase, the probability of observing D increases. SD is never observed in this data set, so is modeled to have a zero probability and is not shown in this Figure. As the respondent measure increases, the probability of category N increases, but it is never the most probably category at any point on the latent variable. With increasing measure, category A becomes most probable, then SA, and finally VSA.
The points at which adjacent categories are equally probable (indicated by arrows) are the Rasch-Andrich thresholds or step calibrations. They are the response-structure parameters of the PCM model. Since category SD is not observed, the equal-probability point between category VSD and SD is modeled to be at plus infinity, and between SD and D is modeled to be at minus infinity. If plotable, they would also be indicated by arrows.
Thus there are 6 Rasch-Andrich adjacent-category equal-probability points. In this example, they are located on the latent variable at {+∞,-∞, 0, -0.5, +1, +2} logits relative to the overall item difficulty. The overall item difficulty is defined as the point at which the lowest and highest categories, VSD and VSA, are equally probable. According to this definition, the sum of the Rasch-Andrich thresholds is zero. Thus, for estimation purposes, the set of Rasch-Andrich thresholds can be approximated by {37.5, -40, 0, -0.5, +1, +2} logits.
The Rasch-Andrich thresholds (arrowed) between categories A and SA, and categories SA and VSA, are in ascending order with the categories along the latent variable. This is termed "ordered". The thresholds between categories D and N and categories N and A are in reverse order on the latent variable to the substantive advance of the categories, D then N then A. This is termed "disordered". So, overall, the Rasch-Andrich thresholds are disordered for this item.
Demarcation by Modal Categories: which category is more likely to be observed?
One approach is to partition the variable according to which category is the most probable to be observed according to the Rasch model. In this example, the intervals correspond to the tops of the "hills" in the Figure. They are VSD: -∞ to -1.25; D: -1.25 to -0.25; A: -0.25 to +1; SA: +1 to +2; VSA: +2 to +∞. This can be summarized as {-1.25, n, -0.25, n, +1.00, +2.00) where "n" means "Non-modal category", i.e., categories SD and N which do not appear. When the Rasch-Andrich thresholds are ordered, then the modal values coincide with those threshold values, and all categories appear on the latent variable.
Demarcation by Median Categories: where do we split the rating scale between high and low?
Another approach is to partition the variable according to which category is in the middle of the probability range. In other words, there is a less than .5 probability that the respondent would choose a category below this category and there is also less than a .5 probability that the respondent would choose a category above this category. L. L. Thurstone reported item locations using medians, so these locations are termed Rasch-Thurstone thresholds.
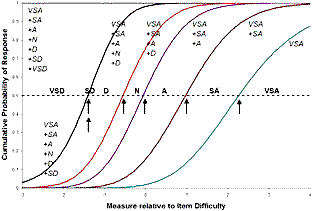 |
| Figure 2. Modeled cumulative category probability curves |
In Figure 2, these are indicated by arrows. They indicate the locations where the cumulative probability curves intersect the .5 probability line. The rightmost curve is the probability of observing category VSA. The next left curve is the accumulated probability of observing VSA or SA. The next left curve is the accumulated probability of VSA or SA or A. And so on. The left most curve would be the probability of observing any of the categories. This always has the value of 1.0. The interval between curves along the .5 probability line corresponds to the median category. These are indicated by arrows.
Category N, which always has a low probability of being observed is shown with a narrow interval. The VAS+SA+A+N+D and VAS+SA+A+N+D+SD curves coincide because SD has zero probability of being observed in this data set. Consequently category SD is regarded as a point located where these curves intersect the .5 probability line.
The Rasch-Thurstone thresholds are useful for indicating the cut-points for the probability that the response will be at or above a certain category or below a certain category. In this example they are {-1.40, -1.40, -.44, -.06, .97, 2.26}.
Demarcation by Mean Categories: where is the average score half-way between two adjacent categories?
A third approach is to identify the intervals by means of the expected average value of the responses at each point on the latent variable. These expected values are the sum of the category values multiplied by their probabilities. These form a monotonic ascending ogive from the lowest category value to the highest category values, 0 to 6 in this example. In this conceptualization, the interval or zone on the latent variable corresponding to, say, category 2, contains the measures corresponding to expected scores on the item from 1.5 to 2.5.
These Rasch-half-point thresholds are indicated by arrows in Figure 3. Each arrowed location can be thought of as the measure on the latent variable at which the average response rating of 1,000 persons is expected to approximate 0.5 score-points away from an integer category value. So these intervals are the zones on the latent variable in which the rounded expected scores are the category values. In this example, they are {-1.94, -1.21, -0.63, +.06, +1.00, +2.53}.
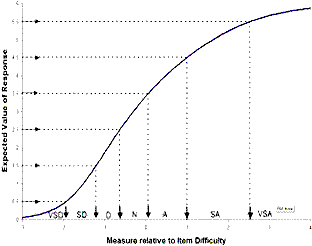 |
| Figure 3. Model expected score ogive for item |
This ogive is fundamental to the estimation of Rasch measures. It is seen that, though category SD (=1) is never observed, an average rating corresponding to its category value of 1 is expected. If this makes no sense for a particular instrument, then the unobserved category must be dropped from the analysis by renumbering the observed categories to exclude the unobserved category. In this case, the categories would be renumbered 0=VSD, 1=D, 2=N, 3=A, 4=SA, 5=VSA.
Communicating with Category Demarcations
The three demarcations communicate the same measurement information, but in ways which answer different questions.
For a person at a particular location on the latent variable:
1. What is the person's most probable response category? The modal category.
2. At or above what response category is the person's probable response? The median category. Also, at or below, etc., what response category?
3. What category value is nearest to the person's average expected response? The mean category.
Practical note: The modal-category interpretation (particularly when the Rasch-Andrich thresholds are ordered) provides a direct connection between the categories most likely to be observed and their measures. The median-category interpretation provides convenient above-or-below locations for cut-points on items when printed on item maps. The mean-category interpretation is useful for summarizing expected sample behavior. It has the advantage of relating the rating scale to the latent variable as one plotted line without explicit mention of the underlying probabilities.
John Michael Linacre
Linacre J.M. (2006) Demarcating Category Intervals … Rasch Measurement Transactions, 2006, 19:3 p. 10341-43
| Forum | Rasch Measurement Forum to discuss any Rasch-related topic |
Go to Top of Page
Go to index of all Rasch Measurement Transactions
AERA members: Join the Rasch Measurement SIG and receive the printed version of RMT
Some back issues of RMT are available as bound volumes
Subscribe to Journal of Applied Measurement
Go to Institute for Objective Measurement Home Page. The Rasch Measurement SIG (AERA) thanks the Institute for Objective Measurement for inviting the publication of Rasch Measurement Transactions on the Institute's website, www.rasch.org.
| Coming Rasch-related Events | |
|---|---|
| May 17 - June 21, 2024, Fri.-Fri. | On-line workshop: Rasch Measurement - Core Topics (E. Smith, Winsteps), www.statistics.com |
| June 12 - 14, 2024, Wed.-Fri. | 1st Scandinavian Applied Measurement Conference, Kristianstad University, Kristianstad, Sweden http://www.hkr.se/samc2024 |
| June 21 - July 19, 2024, Fri.-Fri. | On-line workshop: Rasch Measurement - Further Topics (E. Smith, Winsteps), www.statistics.com |
| Aug. 5 - Aug. 6, 2024, Fri.-Fri. | 2024 Inaugural Conference of the Society for the Study of Measurement (Berkeley, CA), Call for Proposals |
| Aug. 9 - Sept. 6, 2024, Fri.-Fri. | On-line workshop: Many-Facet Rasch Measurement (E. Smith, Facets), www.statistics.com |
| Oct. 4 - Nov. 8, 2024, Fri.-Fri. | On-line workshop: Rasch Measurement - Core Topics (E. Smith, Winsteps), www.statistics.com |
| Jan. 17 - Feb. 21, 2025, Fri.-Fri. | On-line workshop: Rasch Measurement - Core Topics (E. Smith, Winsteps), www.statistics.com |
| May 16 - June 20, 2025, Fri.-Fri. | On-line workshop: Rasch Measurement - Core Topics (E. Smith, Winsteps), www.statistics.com |
| June 20 - July 18, 2025, Fri.-Fri. | On-line workshop: Rasch Measurement - Further Topics (E. Smith, Facets), www.statistics.com |
| Oct. 3 - Nov. 7, 2025, Fri.-Fri. | On-line workshop: Rasch Measurement - Core Topics (E. Smith, Winsteps), www.statistics.com |
The URL of this page is www.rasch.org/rmt/rmt194f.htm
Website: www.rasch.org/rmt/contents.htm