Which statistic is more informative depends on what null hypothesis you are concerned about:
Null hypothesis: "the data fit the model (perfectly)" - use the t-test significance = Winsteps Zstd
Null hypothesis: "the data fit the model (usefully)" - use the chi-square divided by degrees of freedom = mean-square.
"The first of the distributions characteristic of modern tests of significance, though originating with F.R. Helmert [1875], was rediscovered by Karl Pearson in 1900, for the measure of discrepancy between observation and hypothesis, known as χ2 [chi-square].. ... It supplies an exact and objective measure of the joint discrepancy from their expectations of a number of normally distributed ... variates" (R. A. Fisher, Statistical Methods for Research Workers.)
It is the χ2 distribution which underlies many Rasch-model fit statistics. Even those based on the likelihood of the data capitalize on the fact that -2 loge ( likelihood ) is asymptotically χ2.
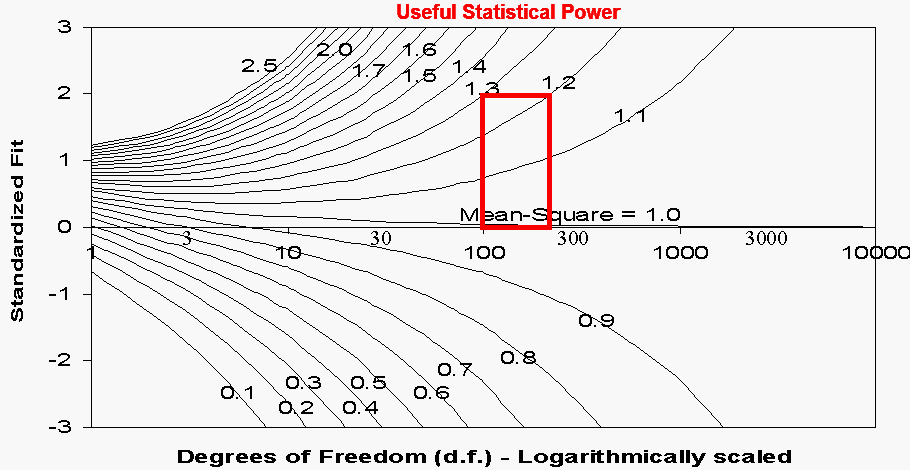
A χ2 statistic with k degrees of freedom, d.f., is the sum of the squares of k random unit-normal deviates. Therefore its expected value is k, and its model variance is 2k. This provides the convenient feature that the expected value of a mean-square statistic, i.e., a χ2 statistic divided by its d.f. is 1.0. But the model variance of a mean-square statistic is 2/k. Thus, as the number of degrees of freedom, i.e., the sample size, increases, the power to detect small divergences increases, and ever smaller departures of the mean-square from 1.0 become statistically "significant", i.e., surprising, if the data are indeed as modeled.
For terminology, etc., see www.rasch.org/rmt/rmt162f.htm
The relationship between the size and significance of mean-square statistics is shown in the Figure. The statistical significance is expressed as the value of the corresponding value on a unit normal distribution. For 2-sided t-tests, 1.96 corresponds to p=.05. For dichotomous responses, d.f. is a little less than sample size (for an item) or test length (for a person). For polytomous responses, d.f. is somewhat less than (sample size or test length)*(polytomous categories - 1).
Test of Perfect Fit
The null hypothesis for a significance test of "perfect" fit of these data would be "Mean-square=1.0". Since the Rasch model is a mathematical ideal, like a Pythagorean triangle, we never expect to encounter empirical data that match it exactly. So this is an instance in which we know, a priori, that the null hypothesis cannot be accepted.
A mean-square of 1.2 means 1 unit of modeled information and .2 of unmodeled noise. The plot indicates that items with as little misfit as this would be flagged as significantly misfitting if observed in samples of over 200 persons. On the other hand, grossly noisy items, with more unmodeled noise than modeled information, i.e., with mean-squares of 2.0 or more, are not flagged in samples of less than 10. Overall, useful sample sizes for standardized fit statistics appear to be in the range 100-250 data points for the "perfect fit" null hypothesis.
Indication of Useful Fit
An indicator of "useful" fit could be "mean-square = 1.5 or less" (e.g., RMT 14:2, p. 743). Then, as the sample size (d.f.) increases, especially beyond 30, there is increasing certainty as to whether these data are productive for measurement (mean-square ≤ 1.5) or unproductive (mean-square > 1.5). This could be formulated as a one-sided t-test of the hypothesis that the mean-square is ≤1.5, with only values >1.5 being of concern.
Informal simulations studies and experience analyzing hundreds of datasets indicate that:
| Interpretation of parameter-level mean-square fit statistics: | |
|---|---|
| >2.0 | Distorts or degrades the measurement system |
| 1.5 - 2.0 | Unproductive for construction of measurement, but not degrading |
| 0.5 - 1.5 | Productive for measurement |
| <0.5 | Less productive for measurement, but not degrading. May produce misleadingly good reliabilities and separations |
See also "Reasonable mean-square fit values" www.rasch.org/rmt/rmt83b.htm
John Michael Linacre
|
|
Rasch Power Analysis: Size vs. Significance: Standardized Chi-Square Fit Statistic. J.M. Linacre … Rasch Measurement Transactions, 2003, 17:1, 918.
| Forum | Rasch Measurement Forum to discuss any Rasch-related topic |
Go to Top of Page
Go to index of all Rasch Measurement Transactions
AERA members: Join the Rasch Measurement SIG and receive the printed version of RMT
Some back issues of RMT are available as bound volumes
Subscribe to Journal of Applied Measurement
Go to Institute for Objective Measurement Home Page. The Rasch Measurement SIG (AERA) thanks the Institute for Objective Measurement for inviting the publication of Rasch Measurement Transactions on the Institute's website, www.rasch.org.
| Coming Rasch-related Events | |
|---|---|
| May. 15 - June 12, 2026, Fri.-Fri. | On-line workshop: Rasch Measurement - Core Topics (E. Smith, Winsteps), www.statistics.com |
| June 19 - July 25, 2026, Fri.-Sat. | On-line workshop: Rasch Measurement - Further Topics (E. Smith, Winsteps), www.statistics.com |
| Aug. 31 - Sept 2 2026, Mon.-Wed. | In person: IMEKO TC1 Metrology Education and Training symposium, Klagenfurt, Austria www.photomet-edumet2026.com. Submissions by April 20 |
| Aug. 30 - Sept. 3, 2027, Mon.-Fri. | In Person: 2027 IMEKO World Congress (TC1, Tc7, TC13, TC18, TC26), Rimini, Italy imeko2027.org |
The URL of this page is www.rasch.org/rmt/rmt171n.htm
Website: www.rasch.org/rmt/contents.htm