Historians and philosophers of science generally agree that measuring linear change lies at the foundations of modern science separating it from Aristotelian physics in the 17th century (Burtt, 1924). Ever since Galileo described laws of terrestrial motion and Newton generalized them to celestial bodies, empirical measures of linear change have advanced theoretical science. Not surprisingly, contemporary social theory suffers desperately from a profound inability to measure linear change with dismal implications for social science.
Cronbach is widely recognized for describing raw score problems measuring change but abandoned this challenge to improve social research methodology by advising researchers to "frame their questions in other ways" (Cronbach & Furby, 1970, p. 80). Virtually all commentaries and methods proposed since Cronbach have attempted to dismiss the limitations of measuring change with raw scores by offering feeble substitutes. In general, these approaches are complicated (Cohen & Cohen, 1975), as well as controversial (see Ragosa et al., 1982), while Collins and Horn (1991) suggest only analyzing change not measuring it.
While the literature is full of discussions about raw score problems in measuring change such as low reliability, spurious negative correlations with initial status, and lack of constant meaning (see Embretson & Reise, 2000), few researchers understand why raw scores are fundamentally flawed. Consequently, the purpose of this report is to present an example of measuring change with both raw scores and linear units that may help clarify this problem.
The data are 25,000 CAP (Child Assessment Profile; Chicago Public Schools, 1993-2002) raw score records that were collected by Chicago preschool teachers in September (Observation 1) and the following June (Observation 2). CAP consists of 65 items that represent five domains of early childhood learning sampled across a hierarchical construct. Teachers dichotomously (0/1) score each child and higher summed scores indicate higher CAP growth. Separation reliability is high (> .95) and person/item fit excellent . Typical CAP items are "Count to 10", "Names colors", and "Writes own name".
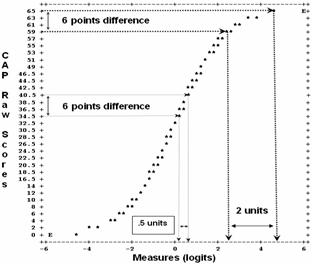
Figure 1. Raw score to linear measure relationship.
Figure 1 shows initial transformation of CAP raw scores to linear logit measures, and, as expected, upper and lower tails show substantial raw score distortions. A six point raw score difference in upper tail is four times greater when represented with logits. While disturbing, these distortions commonly occur in raw score analyses.
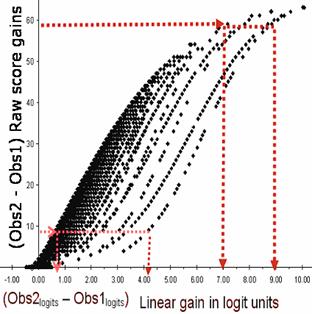
Figure 2. Raw score vs. linear gains
Figure 2 presents a less well known relationship between raw scores and linear measures with important implications for understanding meaningful gain measurement. On the vertical axis appears CAP raw score change between Observations 2 and 1 (Obs2 raw scores - Obs1 raw scores). Then CAP raw scores were transformed to logits and their differences (Obs2 logits - Obs1 logits) appear along the horizontal axis. Consequently, Figure 2 shows ordinal raw score differences matched with corresponding linear differences. Some prominent results are:
1. Every linear difference (Obs2 logits - Obs1 logits ) corresponds to a range of raw score differences. The raw score range differs depending on Observation 1 initial status (see Figure 1).
2. The range of raw scores corresponding to logits is enormous. For example, CAP gain measuring four logits corresponds to a raw score range between 10 and 45 points! Conversely, a 10 point raw score gain corresponds to a logit range between .7 and 4 units.
3. As logit values increase, raw score range diminishes. CAP gain of 7 logits corresponds to a raw score range between 40 and 60 points, while a gain of 9 logits only corresponds to a range between 55 and 60 points.
These results show that raw score change is virtually impossible to interpret with meaning and accuracy because position on the measurement construct is confounded with a nonuniform metric. A 10-point raw score change, for example, appears to be the same for both high and low ability children but thee corresponding linear values show the change for high ability children to be four times greater. A practical result of raw score interpretation is conflation of growth with nonlinearity.
The effect of nonlinearity on growth interpretation in this example may be considered relatively benign because CAP is not high stakes and all children advance to kindergarten. But most children start lower down where raw score distortion tends to inflate growth while underestimating child growth near the top. Moreover, these raw score results suggest that children are much more homogenous than linear units would indicate and this distortion is further obscured when child scores are aggregated by preschool centers.
Although program evaluators will find almost everyone improving on this assessment, raw score convolutions are too complicated to establish useful normative growth expectations or isolate child abnormalities. The common strategy of aggregating raw scores into summary statistics only obscures the underlying problem of unequal scale intervals and eliminates an opportunity to understand individual growth.
Nikolaus Bezruczko
Burtt, E. A. (1924). The Metaphysical Foundations of Modern Science. New York: Doubleday Anchor.
Cohen, J., Cohen, P. (1975). Applied Multiple Regression/Correlation Analysis for Behavioral Sciences. Hillsdale, NJ: Erlbaum.
Collins, L. M., Horn, J. L. (1991). Best Methods for Analyzing Change. Washington, DC: American Psychological Association.
Cronbach, L. J., Furby, L. (1970). How should we measure "change" - or should we? Psychological Bulletin, 74, 68-80.
Embretson, S. E., Reise, S. P. (2000). Item Response Theory for Psychologists. Mahwah, NJ: Erlbaum.
Ragosa, D., Brandt, D., Zimowski, M. (1982). A growth curve approach to measurement of change. Psychological Bulletin, 92, 726-748.
Raw Score Nonlinearity Obscures Growth, Bezruczko N. … Rasch Measurement Transactions, 2004, 18:2 p. 973-974
| Forum | Rasch Measurement Forum to discuss any Rasch-related topic |
Go to Top of Page
Go to index of all Rasch Measurement Transactions
AERA members: Join the Rasch Measurement SIG and receive the printed version of RMT
Some back issues of RMT are available as bound volumes
Subscribe to Journal of Applied Measurement
Go to Institute for Objective Measurement Home Page. The Rasch Measurement SIG (AERA) thanks the Institute for Objective Measurement for inviting the publication of Rasch Measurement Transactions on the Institute's website, www.rasch.org.
| Coming Rasch-related Events | |
|---|---|
| May. 15 - June 12, 2026, Fri.-Fri. | On-line workshop: Rasch Measurement - Core Topics (E. Smith, Winsteps), www.statistics.com |
| June 19 - July 25, 2026, Fri.-Sat. | On-line workshop: Rasch Measurement - Further Topics (E. Smith, Winsteps), www.statistics.com |
| Aug. 31 - Sept 2 2026, Mon.-Wed. | In person: IMEKO TC1 Metrology Education and Training symposium, Klagenfurt, Austria www.photomet-edumet2026.com. Submissions by April 20 |
| Aug. 30 - Sept. 3, 2027, Mon.-Fri. | In Person: 2027 IMEKO World Congress (TC1, Tc7, TC13, TC18, TC26), Rimini, Italy imeko2027.org |
The URL of this page is www.rasch.org/rmt/rmt182a.htm
Website: www.rasch.org/rmt/contents.htm