Obtaining equivalent numerical results from different software packages can be challenging. Item-trait interactions are an example. The RUMM2020 Item Fit Table shows the item-fit output for item I0104 from a RUMM2020 analysis. The Location is the Rasch item difficulty estimate with SE being its standard-error precision. The FitResid is the standardized sum of squared residuals with DF being its estimated degrees of freedom. FitResid is equivalent to the standardized OUTFIT statistic of Winsteps.
|
|
| Item-Trait Interaction |
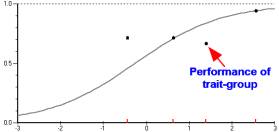
The ChiSq is the item-trait interaction. In this example the latent trait is stratified into four class intervals each containing a trait-group of approximately one quarter of the total person sample. Since there are 4 intervals, there are three degrees of freedom, DF, for the chi-square as indicated. The chi-square is computed from a comparison of the observed overall performance of each trait-group on the item with its expected performance. This quantifies the size of the departure of the empirical item characteristic curve from its model values, so identifying the magnitude of the item-by-trait (item-by-ability level) interaction for this item. Prob reports the statistical probability of observing the chi-square value (or worse) when the data fit the Rasch model. In this example, the chi-square has 3 degrees of freedom and so has an expected value of 3.0. Its observed value is 21.707, with a probability of that value of larger being observed by chance of only 0.000076. So we would reject the null hypothesis that the overall performance of the trait-groups fits the Rasch model. We are observing an item-trait interaction for item I0104.
This item-trait chi-square is featured in RUMM2020 documentation as an indicator of item behavior, more so than the FitResid, but there is no obviously equivalent statistic currently reported by Winsteps. This can be awkward when research teams are employing both software packages. Here is how to generate the equivalent statistic in Winsteps:
This procedure is now implemented as Winsteps Table 30.4 with $DIF=MA3.
1. Decide on the number of trait-groups. 4 here.
2. Order the persons by measure (location). Writing the person-measure PFILE to Excel facilitates these steps.
3. Omit extreme scores. These cannot show an interaction.
4. Stratify the person-ability range into trait-groups of as equal numerical size as possible, keeping all persons with the same measure in the same group.
4. Number the trait-groups and put the trait-group number into each person label.
5. Perform a DIF analysis of item by trait-group-number.
6. Obtain the t-statistic for each item-trait DIF effect.
7. For each item, square and sum the t-statistics for the item-trait groups. This is the RUMM2020 chi-square.
8. The chi-square d.f. is the count of trait-groups less one.
In our example, the Winsteps DIF Table shows each trait-group as a Person Class. The Observations Count is the number of persons in the group. Average is their average rating. Baseline Expect is the expected value of the Observations Average. Measure is the item difficulty measure corresponding to the Baseline Expect rating on this item, Item 104. It is expected to be the same for every trait-group. The DIF Score is the difference between the Observations Average and Baseline Expect ratings. The DIF Measure is the item difficulty that would produce the Observations Average. So that DIF Size is the difference between the Baseline Measure item difficulty and the item difficulty observed for this group, the DIF Measure. S.E. is the standard error of the DIF Size. The t-statistic is a hypothesis test that the DIF Size is due to chance alone, it is the DIF Size divided by its S.E.
The Winsteps t-statistic is approximately a unit-normal deviate. Squaring and summing the four of these for item I0104 amounts to 20.05, close to the RUMM2020 ChiSq of 21.707. Thus this procedure yields approximately the same number as the RUMM2020 ChiSq. Over 72% of the Winsteps chi-square is contributed by the 4th trait-group, indicating that the item-trait interaction is primarily due to the unexpectedly poor performance by the high ability group.
These statistics are sensitive to the number of item-trait groups, so verify that an item is defective (from an item-trait perspective) by replicating this process with different numbers of item-trait groups.
| RUMM2020 Item Fit Table | |||||||||
|---|---|---|---|---|---|---|---|---|---|
| Seq | Item | Type | Location | SE | FitResid | DF | ChiSq | DF | Prob |
| 104 | I0104 | Poly | 0.246 | 0.137 | 2.852 | 228.56 | 21.707 | 3 | 0.000076 |
| Winsteps DIF Table | |||||||||||
|---|---|---|---|---|---|---|---|---|---|---|---|
| Person Class | Observations | Baseline | DIF | Item | Count | Average | Expect | Measure | Score | Measure | Size | S.E. | t | Number | Name |
| 1 2 3 4 | 57 55 59 60 | 0.53 0.62 0.68 0.47 | 0.40 0.55 0.62 0.70 | 0.25 0.25 0.25 0.25 | 0.12 0.07 0.05 -0.23 | -0.27 -0.04 0.02 1.24 | -0.52 -0.29 -0.24 0.99 |
0.27 0.28 0.28 0.26 | -1.92 -1.06 -0.85 3.81 | 104 104 104 104 | I0104 I0104 I0104 I0104 |
John M. Linacre
RUMM2020 Item-Trait Chi-Square and Winsteps DIF Size. Linacre, J.M. … Rasch Measurement Transactions, 2007, 21:1 p. 1096
| Forum | Rasch Measurement Forum to discuss any Rasch-related topic |
Go to Top of Page
Go to index of all Rasch Measurement Transactions
AERA members: Join the Rasch Measurement SIG and receive the printed version of RMT
Some back issues of RMT are available as bound volumes
Subscribe to Journal of Applied Measurement
Go to Institute for Objective Measurement Home Page. The Rasch Measurement SIG (AERA) thanks the Institute for Objective Measurement for inviting the publication of Rasch Measurement Transactions on the Institute's website, www.rasch.org.
| Coming Rasch-related Events | |
|---|---|
| May. 15 - June 12, 2026, Fri.-Fri. | On-line workshop: Rasch Measurement - Core Topics (E. Smith, Winsteps), www.statistics.com |
| June 19 - July 25, 2026, Fri.-Sat. | On-line workshop: Rasch Measurement - Further Topics (E. Smith, Winsteps), www.statistics.com |
| Aug. 31 - Sept 2 2026, Mon.-Wed. | In person: IMEKO TC1 Metrology Education and Training symposium, Klagenfurt, Austria www.photomet-edumet2026.com. Submissions by April 20 |
| Aug. 30 - Sept. 3, 2027, Mon.-Fri. | In Person: 2027 IMEKO World Congress (TC1, Tc7, TC13, TC18, TC26), Rimini, Italy imeko2027.org |
The URL of this page is www.rasch.org/rmt/rmt211k.htm
Website: www.rasch.org/rmt/contents.htm