Rasch Forum: 2006
Rasch Forum: 2007
Rasch Forum: 2008
Rasch Forum: 2009
Rasch Forum: 2010
Rasch Forum: 2011
Rasch Forum: 2012
Rasch Forum: 2013 January-June
Rasch Forum: 2014
Current Rasch Forum
Firoozi December 5th, 2013, 1:16pm: Conducting a study on the construct validity of Iranian national university entrance exam applying Rasch model, IÆm on the fence about interpreting the results of the DIF output Table. Following DrabaÆs (1977) criterion, an item estimate difference > 0.5 logits, no DIF item is found. On the other hand, 10 out of 16 items flag for DIF in the ōProbö column (P<0.05). One point that may commit a Type 1 error is the large sample size of the study, 18,821 participants. For more clarification the DIF Table of the study is attached. I would appreciate your suggestion about what criterion to follow in reporting the DIF output of my study.
Mike.Linacre:
Thank you for asking, Firoozi.
In a DIF analysis, we need both size and significance:
Significance: the DIF effect must be improbable enough not to be only an accident. Your sample size is so large that a very small DIF effect is not an accident statistically.
Size: the DIF effect must be big enough to make a substantive difference to decisions based on the test. You must decide what "size" criterion to apply. For a test of 16 dichotomous items, every person ability measure has a standard error greater than 0.5 logits. (Please look at your output to confirm this). The size of the biggest DIF of 0.31 logits (ITEM 4) is smaller than the measurement error of the person measures. The average impact of that DIF on the person measures is DIF/(number of items) = 0.31/16 = 0.02 logits.
gleaner:
For a test of say for example 15 items measuring a common latent trait (e.g. listening, or anxiety). When only 4 of 15 items has DIF present effect, while in the other items, they have not.
Shall we reject the hypothsis that the ability calibrated in the test of 15 items has DIF effect?
Mike.Linacre:
Gleaner, lawyers for minority groups love to make a big fuss about DIF, but often, when we look at the overall effect of DIF on the person measures for the group we discover that those lawyers are "full of sound and fury, signifying nothing." (Shakespeare).
So, what is the effect of those 4 DIF items on the mean ability estimate of the focus group? The size of the overall DIF effect is (sum of 4 DIF effects)/15. On a test of 15 items, this is almost certainly much less than the S.E. of a person measure, so it would be undetectable for an individual. But it could be noticeable for a whole group. So let us compare this overall DIF size to the S.E. of the mean ability of the focus group. If the overall DIF effect is greater than 2*S.E (mean focus group), then we can say that the DIF is statistically significant for the group, even if it is not significant for an individual in the group.
Firoozi:
Thank for your helpful suggestion Dr. Linacre.
You mentioned according to the attached DIF Table, the standard error for each person measure is greater than the DIF contrast of the two classes. Now the problem is that the columns I see in the Table refer to the standard error of item measure not the person and their values are less than the DIF contrast. For example, the ōDIF CONTRASTö value for ITEM 4 is 0.31 and its standard error for the second class is 0.02. I would be most grateful if you make this claim more clear to me.
Mike.Linacre:
Firoozi, please look at the person-measure Tables. For instance, in Winsteps Table 3.1, what is the average person-measure S.E.?
Now compare that average S.E. with the size of the item DIF ....
gleaner: Thanks a lot, Dr Linacre!
uve: Would it be Table 3.1 for all persons or Table 28.3 for the focus group in question?
Mike.Linacre: Uve, it would be surprising if the two Tables led us to different conclusions. However, since DIF is so political, choose the Table with the smaller average person-measure S.E.
Firoozi:
Dear Dr.Linacre,
Thanks for your previous helpful guidelines on investigating DIF. Following Messick's (1989, 1995) six aspects of construct validity to provide evidence for (in)validity of the Iranian University Entrance Exam, I found different evidences in support of invalidity of the test. The attached person-item maps of different sections of the test can be regarded as a prima facie evidence for the invalidity of this high stake test. In addition, the mean square and standard fit indices of 6 out of 16 grammar items, 7 out of 14 vocabulary items, and 11 out of 20 reading items are beyond the acceptable value proposed by Wright and Linacre (1994). However, following DrabaÆs (1977) criterion, and applying your guidelines, none of the sixty items of the test show gender DIF. Now, the question is that how can we consider these DIF free items logical while no other evidences support the validity of the test. As clear from the attached Figure, the bulk of the items on the left are above the ability level of the majority of the persons on the right. Hence, can we regard the misfiting items as a justification for DIF free items?
Mike.Linacre:
Thank you for your question, Firoozi.
What type of items are these? Rating scales? Partial credit? Multiple choice? Cloze?
If these are multiple-choice questions, please verify that the multiple-choice scoring key is correctly applied.
Firoozi: The test is 6o multiple choice questions. I checked the answer key again and made sure that it was correctly applied. One point worth mentioning is that all the missing values is replaced by zero in the data. could DIF free items be as the result of this recoding?
Mike.Linacre:
Yes Firoozi. If "missing" means "skipped", then score as 0 for DIF, but if "missing" means "not reached", then score as "not administered" for DIF.
If this is MCQ, then many examinees are much below the guessing-level, and so the validity of the test is in doubt. Are they merely guessing or response-setting or other unwanted behavior?
gleaner:
So for MCQ, before entering responses for Rasch analysis, the categorization of missing values should be done very carefully, shall I understand this way, Dr Linacre?
However, it is not so easy to discriminate all the missing responses into skipped or not reached.
Probably, if test developers would like to put missing responses into the two categories, post-test interview might be necessary.
Sorry to put in this quesiton in this thread.
How about the missing responses in the other types of research methods, e.g. survey, rating scale? Do the missing responses need to be carefully categorized as well before entering data for analysis?
Thanks a lot!
Mike.Linacre:
Gleaner, the missing responses need to be categorized according to their reasons, and also the purposes of the analysis.
For instance, for measuring the persons, we may want to make all missing responses into wrong answers = 0.
But, for calibrating the items, we may only want to score a wrong answer when an examinee has thought about the question and decided not to answer = skipped.
We usually treat as "skipped" any missing response before the last answered question. All missing responses after the last answered question are "not reached" = "not administered".
So, a procedure is:
1) estimate the item difficulties: skipped=0, not reached = not administered
DIF studies are done here.
2) estimate the person measures for reporting: skipped =0, not reached=0, and the items are anchored (fixed) at their estimated difficulties from 1).
gleaner:
I see why it is a must for categorizing missing responses according to research purposes and reasons.
If necessary, for calibrating items, there is a possibility that some of the missing responses are simply not reached or administered, while some of them skipped for lack of time or beyond the test takers' proficiency. However, it is very likely that test takers would keep all the items answered by wild guesses, since no wrong responses are charged points off their score and the time is available for filling them all though not for careful consideration.
For the skipped and the not reached missing responses, if "We usually treat as "skipped" any missing response before the last answered question. All missing responses after the last answered question are "not reached" = "not administered"." and we can rule out the possibility that the test taker simply answer under the state of wild guess on the last answered item. So the exact situation is far more complex as you said. Right?
Mike.Linacre: Yes, Gleaner. An example is: https://www.rasch.org/rmt/rmt61e.htm
gleaner:
Thanks a lot, Dr Linacre, for teaching and help that you give in my learning!
Happy New Year to you and all the other Rasch pals in the forums!
gleaner December 27th, 2013, 2:49am:
Recent issue of RMT asks the question "Is now the time for a Rasch
measurement MOOC?"
Yes indeed. It is the optimal occasion for Rasch to go MOOC.
Some online courses on Rasch are available but are exclusive to some, not all people of all walks who are interested in Rasch. It is a pity indeed.
Mike.Linacre:
Yes, gleaner, Massive Open Online Courses for Rasch would be wonderful. The problem is that, though MOOC may be free to participants, they cost a lot of time, money and resources to construct and sometimes to operate.
www.winsteps.com/tutorials.htm is a step in that direction for Rasch.
gleaner:
Yes, MOOC courses cost a lot to create.
I watched some free video clips on Rasch you kindly created and uploaded ( probably so because the uploader ;D named by Linacre as well) online.
Thanks a lot, Dr Linacre, for your Rasch on the run and free tutorials on winsteps and facets!
Hope to see someone will create the first MOOC on Rasch soon. There are a lot on CTT illustrating with examples of R or SPSS.
Mike.Linacre: Yes, gleaner. Some Rasch functionality is available with many software packages, such as R, - see https://www.rasch.org/software.htm . It would be great if an R expert composed a tutorial in which a competent Rasch analysis of a meaningful dataset is conducted with R. One by-product would be a suite of R procedures with most of the functionality of Winsteps or RUMM.
gleaner:
R is gaining momentum in statistics.
Probably R will survive and thrive in the future if it is appreciated by the general public. So far Winsteps and Facets still reign when it comes to Rasch analysis. They are two of the most popular softwares.
gleaner December 22nd, 2013, 12:42pm:
New addition to Rasch literature is a book from SpringerLink
Boone, W. J., Staver, J. R., & Yale, M. S. (2013). Rasch analysis in the human sciences: Springer.
Rasch is fantastic and amazing. It does contribute to new insights into some old issues. Simple, qualitative as well as quantitative.
A great coursebook for Rasch newbies like me at least.
Practical and reader-friendly. Theory and practice combined. However, one critical point is missing. What can't Rasch do? Or what is the limitation of Rasch?
For sure in order to avoid the abuse of Rasch in research, the scope of Rasch needs to be defined.
It seems that no Rasch advocates tell the Rasch newbie about that.
How do you think about the issue, Dr Linacre? Thanks a lot!
Mike.Linacre:
Thank you for requesting my input, gleaner.
The scope of Rasch is easy to define:
If you want to construct a unidimensional variable from ordinal data, with the resulting estimates (person abilities, item difficulties) delineated in equal-interval (additive) units, then use Rasch.
Otherwise, don't.
The usual "otherwise" situation is that you want to describe (summarize) the data in a not-to-complex way. Person raw scores and item p-values are the most common simple summaries, i.e., Classical Test Theory (CTT). If CTT is deemed too simple, then Lord's Item Response Theory (IRT) models are the next increment in complexity of describing data. And, if you want yet greater descriptive complexity, data-mining methodology awaits.
OK, gleaner?
gleaner:
Thanks a lot for your prompt reply on this.
If every coursebook on statistics had some more information on what can't be done with the statistics learned, then that would be better.
Because some books on statistics appear to be preaching that hey boy, this is the best yet to be, there can't be better. But the reality is not the case.
There is an issue of appropriateness of adopting some statistics method and matching research question with the statistical tool.
Mike.Linacre: Indeed so, gleaner. Perhaps we statisticians (and software developers) have more in common with used-car salesmen than we would like to think .... :-(
gleaner:
Thanks a lot, Dr Linacre, for your insight into Rasch and statistics!
Frankly, I learn from the forum you kindly create and maintain, not only the beauty of Rasch but also that of statistics.
Thanks a lot, Dr Linacre!
Jessica December 19th, 2013, 1:25pm: Hi, everyone! I met a problem in analyzing my data. I found some misfitting persons in my data, I want to remove them first in order to decrease their influence in measure calibration before reinstating them. I wonder whether there is any criteria for deleting these persons? And should the criteria change with different sample sizes (for example, with a size of over 500, should the criteria be also less strict)? Which fit statistics should we use? Outfit Mnsq or its ZSTD? In some papers, I found some people used infit Mnsq 1.5, while others applied the same criteria (like 0.7 to 1.3) to person fit. Besides the experimental and painstaking way of removing misfitting persons one by one to compare the change in item measure hierarchy, are there any rules telling you when you can stop removing them? (like when all or almost all of the items have their outfit values within their reasonable range, then you can stop?)
gleaner:
Some lesson from Dear Dr Linacre! It is illuminating for me. I hope that it is too for you as well.
https://www.rasch.org/rmt/rmt234h.htm
Jessica: Thanks. Gleaner. That's very helpful. :)
Jessica December 19th, 2013, 2:19pm:
Hi, everyone, I have another question regarding setting critical item fit values for large sample size.
In Bond & Fox (2007), they mentioned the dilemma of using either fit Mnsq or their ZSTD with large sample size. In Liu (2010), he mentioned a study by Smith, Schumacker and Bush (1998) finding that when sample size was over 500, corrections to commonly used MNSQ fit statistics criteria (e.g, MNSQ to be within 0.7 to 1.3) should be made. I found the paper by Smith, Schumacker and Bush (1998), and in the end they mentioned that Wright (1996) suggests for a sample with a size over 500, the critical item infit Mnsq should be 1 + 2/Sqrt (x) and item outfit Mnsq should be 1 + 6/Sqrt (x), where x = the sample size. Should I apply this criteria in my study with a sample of around 540?
I found this criteria really strict afer applying it in my data: more more items are identified as misfit than applying the more commonly used fit range (0.7 to 1.3). But if I use the more lenient criteria, I am worried that some misfitting items couldn't be identified. McNamara (1996: p. 181) says the item fit range should be the mean fit value plus and minus twice the mean square statistic. I just couldn't decide which criteria I should use in my data which are all multiple choice questions. Can anybody help me?
Mike.Linacre:
Thank you for your questions, Jessica.
There are several aspects to what you have written.
1) Is it essential to your work to have data that fit the Rasch model perfectly?
The answer is "Generally not." As philosopher-of-science Larry Laudan writes: "Empirical problems are frequently solved because, for problem solving purposes, we do not require an exact, but only an approximate, resemblance between theoretical results and experimental ones."
2) How much misfit is acceptable? For this, we can use the "window-cleaning" or "onion-peeling" analogy. We can always get a cleaner window by cleaning it again, but we usually stop when the window is clean enough. So see, "When to stop removing ..." https://www.rasch.org/rmt/rmt234g.htm
3) The relationship between mean-squares and ZSTD or t-statistics is well understood. For practical purposes, significance tests lose their value for sample sizes of over 300. See the graph at https://www.rasch.org/rmt/rmt171n.htm
4) General guidance about mean-squares see "Reasonable Mean-Square fit values" - https://www.rasch.org/rmt/rmt83b.htm
Hope these help you, Jessica.
Jessica:
Dear Dr. Linacre,
Thank you so much for your help! Your suggestion is very enlightening and helpful! Now I can move on with my work with more confidence. :).
But I still have another question: if most of us are not concerned about perfect data-model fit (I guess), what is the value of reporting the item/person fit ZSTD (I saw some authors give fit ZSTD, but do not discuss them)? Since the conventional infit/outfit MNSQ provide sufficient information for us to identify the misfitting items, should we just ignore their fit ZSTDs?
Speaking of this, I can't help raising another question about item outfit. I saw some researchers only reported item infit MNSQ as criteria for removing misfitting items while ignoring their outfit MNSQ. And you also mentioned bigger item outfit is a less threat to the validity of the test and can be remedied. If I have to report each item and person measure accurately (as I still want to study the predictive validity of the test), does that mean I need to take away some misfitting people first and then reinstate them after I anchor the good values to the whole item/person sample (as you suggested)?
Mike.Linacre:
Jessica, please think about your audience and the reviewers of your work.
If your audience are familiar with conventional statistical analysis, then they will expect to see significance tests. However, there seems to be no point in reporting those tests (ZSTDs) if there is no discussion of them.
Infit and outfit fit statistics are unlikely to influence the predictive validity of a test. The usual indicator of predictive validity is the correlation between the person measures and an external (demographic?) variable. For instance, a grade-school arithmetic test is expected to have a high correlation between the ability measures of the students and their grade-levels.
We are usually more concerned about infit and outfit statistics when we are evaluating the construct validity of a test. Is it measuring what it is supposed to measure? For instance, on an arithmetic test, we expect the easiest items to be addition, then more difficult is subtraction, more difficult again is multiplication, and most difficult is division. If the arithmetic items do not follow that overall pattern, then the construct validity of the test is in doubt. For instance, if we notice a geography item among the multiplication items, then it does not matter how well it fits statistically, it should not be part of an arithmetic test.
Infit or outfit? If your audience is familiar with conventional statistics, then outfit is preferable because it is a converntional chi-square statistic divided by its d.f., Infit is an information-weighted chi-square (not used in conventional statistical analysis) and Infit is much more difficult to explain to an audience to whom Rasch analysis is new.
Misfitting persons: unless there is a huge proportion of hugely misfitting persons (such as an extremely misbehaving cohort guessing wildly on a multiple-choice test), the misfitting persons will have no effect on the findings you make about your test. They are like smudges on a window-pane. They have no real effect on the view though the window. However, if in doubt, analyze the data both ways. If the findings are substantively different, then that is a finding itself.
Here is a thought: in what way can you explain your own findings most clearly to yourself? Then that is the way to explain your findings to your audience.
Jessica:
Dear Dr. Linacre,
Thanks a lot for your prompt reply. Your explanation makes things much clearer to me. Your help is greatly appreciated. :)
oosta December 19th, 2013, 9:19pm: When I anchor some of my items, Winsteps says that I have two subsets. Table 13.1 (Item statistics) displays "Subset 1" next to each item. However, there are subsets only when I anchor some items. The two analyses and data are identical except for the presence/absence of the IAFILE statement.
oosta: Clarification: "Subset 1" is displayed next to each unanchored item. Nothing (related to subsets) is displayed next to the anchored items.
Mike.Linacre:
My apologies, Oosta. This is a known bug in Winsteps 3.80.1
Please email mike\~/winsteps.com to obtain a pre-release version of winsteps 3.80.2 which has this bug squashed.
Johnena December 19th, 2013, 3:05am:
dear all.
I am a new member here, thank you for holding such a warmful place.
I am still a student, and I am doing the research on child language acquisition test. the puzzle i had met is how to group the subjects into different age group? for example,3 years old, 4-years old and 5 years old.Meanwhile, the difference between the groups should also be significant, i like winsteps very much but i am still in the progress of studying the winsteps, I want to use winsteps to do this group-division, but i don't know how.
so ,could you kindly give me some suggestions? :)
sincerely
Johnena
Mike.Linacre:
Glad you can join us, Johnena.
1. Put an age code into the person label. For instance, age in years, or age in 6-month increments.
2. Run a Winsteps analysis.
3. If you have a smallish sample of students, then output a person map displaying the age code for each student: Winsteps Table 16, suing PMAP= to identify the age-code columns in the person label. If there is an age-related pattern, you should be able to see it.
4. Output sub-totals by person group using the age code. Winsteps Table 28.
Table 28.1 - https://www.winsteps.com/winman/index.htm?table28_1.htm - will tell you if there is a significant difference between pairs of age-codes.
acdwyer77 December 18th, 2013, 6:03pm:
I just analyzed an exam with a bunch of dichotomously scored MC questions using the Rasch model. I would have expected the PTMEAS and DISCRM columns in the item output to be highly correlated. The correlation I am finding between those columns is around .65, but I would have expected it to be 0.9 or higher. The correlation between MEASURE and classical item difficulty, for example, is much higher.
First, I would like to confirm my understanding that PTMEAS is the classical point biserial correlation for the item and that DISCRM is the IRT discrimination parameter if the 2PL model had been implemented. Is that correct?
If my understanding of those two statistics is correct, do you have a quick answer as to why this correlation is low (or a good reference)? Is it because discrimination estimates require larger sample sizes in order to be stable? The examinee sample size for these items ranges from 600 to 1100, fyi.
Thanks!
Mike.Linacre:
acdwyer77, PTMEAS is the point-measure correlation. The classical correlation is the point-biserial. There are two versions in Winsteps:
PTBIS=Y - the point-biserial excluding the correlated observation from the total score
PTBIS=Y - the point-biserial including the correlated observation in the total score
The point-biserial is highly influenced by outlying high and low observations.
DISCRIM is an approximation to the 2-PL IRT discrimination parameter. In Winsteps, it excludes outlying high and low observations. These contribute to the upper and lower asymptotes.
PTMEAS and DISCRIM are expected to be more highly correlated when the outlying observations are trimmed using CUTLO= and CUTHI=
Student123 December 6th, 2013, 1:23pm:
I read this report: http://digibug.ugr.es/bitstream/10481/24229/1/Padilla_Benitez_Hidalgo_Sireci_NERA2011.pdf.
They used cognitive interviews with the following questions to follow up their DIF-analysis:
Tell me what ōbroad science topicsö etc. are for you in school.
When you responded to the first statement which said ōI generally have fun when I
am learning broad science topicsö, what situations were you thinking of? (places, times, etc.)
Also, statement b) says ōI like reading about broad scienceö. What situations were
you thinking of when responding?
Tell me examples of ōbroad science problemsö you have thought about when
responding to the statement ōI am happy doing broad science problems.ö
In the phrase "I am interested in learning about broad science ", you have answered
_______ (See and read the alternative marked by the participant in statement e), explain your answer, why did you answer that.
What have you understood for ōI am interestedö, in the sentence ōI am interested in learning about broad scienceö?
Your reply has been ____ (See and read again the alternative marked in statement
e) In this sentence, what would your "interest in learning about broad science" be? (what would you do, think, etc..) so that your answer would be ____ (read the alternative furthest from that marked by the participant).
A significant ANOVA tells very little about the respondents thoughts about the items or what goes through their minds when they answer a certain instrument. Shouldn't every Rasch study include qualitative interviews (when resources allow it)? Is there any standard or routine procedure for how these interviews might be conducted in Rasch studies?
Mike.Linacre: Student123, yes, the situation you describe applies to all methods of quantitative statistical analysis. For instance, in the USA there is an on-going argument about the meaning of the unemployment percentages. We always need good qualitative information in order to understand what the numbers are telling us. There is no standard or routine procedure. There probably never will be a standard procedure, but hopefully combining quantitative and qualitative methodologies will one day become routine.
Student123:
Debate.
My impression of the general debate in Sweden is that statistics about unemployment and sick leave benefits are seen as inaccurate.
Some argue that people are excluded by being caught in welfare systems and that there is a need to give people opportunity to participate in the labor market again. Therefore the percentages about sick leave benefits does not say much about the average health in society.
Others argue that many who are ill does not get the sick leave benefits they should, insted they are included in employment agency programs along with the unemployed. Programs which in the statistics are recorded as "new job-opportunities". The employment percentages are then seen as misleading.
The problem seems to be that populations "unemployed", "new job-opportunities", sicklisted etc. are poorly defined based on political standpoints.
Interviewing.
"The cognitive interviewing approach to evaluating sources of response error in survey questionnaires was developed during the 1980's through an interdisciplinary effort by survey methodologists and psychologists." (Willis, 1994. p. 1).
"The cognitive approach to the design of questionnaires has generated a body of methodological research... Several Federal statistical agencies, as well as some private survey research organizations, including Research Triangle Institute (RTI), now routinely carry out cognitive interviewing activities on a wide variety of survey questionnaires." (ibid.).
mdilbone December 16th, 2013, 8:41pm:
Hi,
I need some advice with item fit interpretation for polytomous model.
The mean-square statistics for items are pretty good. Only one item has a fit over two and the others fall between .7-1.7. However, for some of these same items the z-standard fit stats are outrageously high and low. Ranging from 9 to -5.
What is this telling me?
I have not seen many authors report z-standard fit stats, only the mean-squares. What is the reason for this?
Many thanks!
Megan
Mike.Linacre:
Thank you for your questions, Megan.
Those numbers are telling us there is a large sample size. From the graph at https://www.winsteps.com/winman/index.htm?diagnosingmisfit.htm (a larger version of https://www.rasch.org/rmt/rmt171n.htm ) the sample size appears to be around 600.
Conventional statisticians, who only see numbers and not their meanings, have no idea what the size of a number (such as a mean-square) indicates. They can only answer the question "Is this number due to chance or not?" - i.e., a significance test.
Rasch analysis is somewhat different. We know the meanings of our numbers. So the question for us is "Is this number substantively important or not?"
We can apply the same logic to cleaning windows. Significance test: "Is this window clean or not?" Mean-square: "How dirty is this window? Is it dirty enough that we need to take action?" For most of us, a smudge or two on a window, so that the window is not "clean", is not enough to provoke us to take action.
suguess December 13th, 2013, 9:18am:
Dear Prof. Linacre,
Good morning! I have some questions about the FACETS specifications error F1 and I hope you could lend me a hand, thanks a lot!
What I want to specify is the task difficulty, and the data is 187 essays of 2 different prompts rated by 10 raters separately, i.e. 1 rater will rate almost 20 essays. But the software runs into error F1, and I have checked the user mannual but find no way out. Attached is my data specification. Your help is greatly appreciated.
Best regards,
Youshine
Mike.Linacre:
Thank you for your question, Youshine.
Look at this:
001,1,1,7.22
The rating is "7.22".
Ratings must be integers on a rating scale.
Where does the number 7.22 come from?
suguess:
Thanks for your prompt reply.
Actually the original rating scale allows decimals because the score of every essay is a weighted mean from three parts.
Does it mean that the software cannot analyze the data because of the decimal rating?
Thanks!
Mike.Linacre:
Youshine, Facets expects the ratings of the parts (integers) and the weights of the parts. Are those available?
If not, do you know what the weights of the parts were? We may be able to reconstruct the original ratings of the parts from the decimal ratings.
suguess:
Thanks for your help.
The original ratings and weighting of each part are available, but there are still such scores with demimals as 6.5 or 7.5. Will we be able to reconstruct the data?
Besides, I did not ask raters to do some multiple rating of each easay, so the data might not be good for Facets?
Mike.Linacre:
Youshine, 6.5 and 7.5 are no problem. We double the ratings (13, 15) and halve the weighting. Yes, we should be able to reconstruct the data usefully.
The design may not be the best for Facets, but Facets should provide valuable information.
suguess:
Thanks a lot for your help.
Then I will sort out the original data and ask for your advice later.
:)
bfarah December 14th, 2013, 3:02am:
Sorry Prof. Linacre,
I could not attach both files in 1 post, so here is the runfile
Thank you for your assistance
Farah Bahrouni
Mike.Linacre:
Thank you for your posts, Farah.
1. Facet 1 (examinees) is anchored, so it is constrained.
Only Facets 3 (L1) is not anchored, so please specify it as
Non-centered = 3
When this is done, the estimation converges after about 50 iterations.
2. Reliabilities. These have little meaning for anchored elements, because the anchor values are not obtained from these data. Notice the large "Displacements".
3. Orientation of facets. Please be sure that the elements in the facets are oriented in the direction you intend:
Positive = ability, easiness, leniency
Negative = inability, difficulty, severity
4. Please be sure that the anchor values for the elements are oriented in the same direction as the facet.
5. Separation and strata: see www.rasch.org/rmt/rmt163f.htm
bfarah:
Thank you for your prompt reply. I'll try your suggestions and let you know.
God bless you
Farah
bfarah:
Dear Prof. Linacre,
Thank you so much for your assistance.
Following your instructions, I have solved the iteration and the 'Warning 7' problems. On the other hand, I'm still struggling with table 7.3.1 (the L1 report), where the severe appears to be lenient and vice versa. You suggested to orient the anchored facets the same way as they are in the file commands, so I copied and pasted the anchored values, but it did not help. The orientation I have is not different from what is in Facets manual.
Could you please show me how to do it. Please refer to the attached files in my earlier posts entitled 'Concerns'.
I appreciate your help
Thank you
Farah Bahrouni
Mike.Linacre:
Farah, if you want L1 oriented as "Ability", then
Positive = 1,3 ; Examinee and L1: higher score -> higher measure
bfarah:
Thank you so much.
The attached table shows what I got when I set facets 1, 3 to positive: it has just reversed the order the facets are displayed in the columns, but the values remained unchanged, so the problem has not been solved. Please advise
Thank you
Farah
Mike.Linacre:
Farah, this analysis is difficult to interpret because:
1) there are anchored elements
2) each L1 is specified to define its own rating scale
3) the data are not completely crossed
If we remove the anchoring, except for group-anchoring the 8 subsets of raters at 0, and have a common rating scale, then we see:
Anchored (Original) Unanchored
+---------------------------------------------------------------+-----------------
| Total Total Obsvd Fair(M)| | |Fair(M)| |
| Score Count Average Average|Measure | N L1 |Average|Measure |
|--------------------------------+--------+---------------------|-------+--------+
| 1145 240 4.77 5.00 | -0.49 | 3 Indian | 4.87 | -1.10 |
| 1188 240 4.95 4.78 | -0.98 | 1 Native | 4.95 | -1.30 |
| 1224 240 5.10 5.00 | -0.89 | 2 Arab | 5.10 | -1.64 |
| 499 96 5.20 5.40 | -0.95 | 4 Russian | 5.09 | -1.60 |
|--------------------------------+--------+---------------------|-------+--------+
Notice that in the unanchored analysis, the Fair Averages are close to the Observed Averages
bfarah December 14th, 2013, 2:59am:
Dear Professor Linacre,
I am investigating the effects of rater L1 and experiential backgrounds on their writing assessment behavior. Experience is restricted to teaching the course the participating students are taking, as ESL/EFL teaching experience is a prerequisite criterion for being recruited at this place, so everybody is well experienced in that respect, therefore, taking it as a variable would be redundant.
For this, I had 68 raters from 4 different L1 backgrounds (20 Natives, 20 Arabs, 20 Indians, and 8 Russians) score analytically 3 essays written by 3 Omani (Arab) students on 4 categories: Task Achievement, Coherence & Cohesion, Vocabulary, and Grammar Accuracy using a 7-point scale for each category. I used FACETS to analyze the data for 5 facets: Examinees, Raters, L1, Experience, and Category. I attach herewith the Run file and the Output file. Could please look at them, check if there are errors in the Run file, and help me with the following questions, thanking you in advance for your assistance:
1. First, when I run the program, it does not not converge. It keeps on going until I press the stop button
2. I get this message at the top of Table 3: Warning (7)! Over-constrained? Noncenter= not in effect. I have non-centered facet 1, but it did help. I'm still receiving the same message.
3. Examinee Measurement Report: Is Reliability = 1 OK there?
4. Looking at Table 7.2.1 (Raters Measurement Report), I am concerned about the S.E. values. Don't you think they are rather high? If so, what is this due to? Do they affect the accuracy of the generated measures? I am concerned because I do not know how high S.E. should be to cause a serious threat to the estimation precision.
5. Moving to Table 7.3.1 (L1 Measurement Report): When we look at the measures we find that the Native group is the most severe, followed by the Indians, then come the Arabs, while the Russians are the most lenient . The most severe group should have the least total score (column 1) and their observed average (column 3) should be less than the expected average (column 4). It seems to me that the Native group and the Indian group are reversed. I also notice that the Observed Average for the Russians, the most lenient group, is less than the Fair Average, which to my understanding means they are severe, not lenient. I could not understand what is going on there. Please advise
6. Table 7.4.1 (Experience Measurement Report): My concern here is related to the Reliability and the Separation indices: Reliability = 0, Separation index = 0. Is this normal? Can this happen? Otherwise, please advise on what is wrong, and how to rectify that.
7. In the case of Experience, what does Reliability refer to? I mean does it refer to the measures generated by FACETS analysis, or to the ratings of the Experienced and Novice rater groups? In case the answer is the 2nd, how can we explain the fact that all facets (same raters, same ratings) are reliable except for Experience?
8. What is the difference between Separation index and Strata index? How is the latter interpreted?
I apologize for this rather long message; I just wanted to make myself as clear as possible
Thank you for your assistance
Best regards
Farah Bahrouni
Elina December 13th, 2013, 8:37am:
Hello Mike
I've got two questions this time. This is a very small data: 21 items and 93 persons.
Q1: I got a warning "Data are ambiguously connected into 2 subsets.". In the subset 2 there's only one person (the only one having maximum score). Do I have a problem here?
Q2: Maximum score is 22, because of one partial credit item. However, in table 20.2 there are scores up to 42. Row 22 seems to be almost fine (CUM. FREQ. 93 and 100.0 but PERCENTILE 99). In the rows 23-42 measure still grows, S.E. varies, FREQ. is 0, CUM. FREQ. is 93 and 100.0 and PERCENTILE is finally 100. Oh why?
Elina
Mike.Linacre:
Elina:
Q1 & Q2: The problem is one partial-credit item, but the "Rating Scale" Model is specified.
In Winsteps, please be sure that ISGROUPS= is active (no ; ) and is correctly specified, something like:
ISGROUPS=DDDDDDDDDDDDDDDDDDDDP
In Winsteps output, there must be Table 3.2 and Table 3.3
Elina:
Thank you, problems disappeared. I had tried to use GROUPS = 0.
Elina
Mike.Linacre:
Elina,
GROUPS = 0 also works, but it was probably
; GROUPS = 0 which is a comment
; means "ignore whatever follows"
Elina: So embarrassed... I seem to have forgotten ; this time. Thanks!
aureliel December 12th, 2013, 1:48pm:
Dear all,
In our data, we think people from two different groups use the rating scale differently (category probability curves look differently for both groups). I would like to test whether these curves are statistically/significantly/truly different for both groups or not (a differential category functioning analysis instead of a dif analysis). Would anyone whether this is possible?
Kind regards,
Aurelie
Mike.Linacre: Aurelie, you could try a chi-squared test of a 2(groups)x(categories) cross-tabulation.
aureliel:
Dear Mike,
thank you for your reply. Yes, I have done a chi-square and category frequencies do differ between groups.
However, I thought that using Rasch analyses you could say more nuanced things about a rating scale, such as about the ordering and the 'difficulty' (treshold). Could you compare those aspects across groups as well?
Thanks for your advice!
Kind regards,
Aurelie
Mike.Linacre:
Aurelie, we can certainly make some descriptive comparisons based on thresholds. Usually we can make the same comparisons by looking at the category frequencies. We like to see a smooth distribution of frequencies. Sharp peaks or troughs in the frequency distribution can be problematic.
A "non-uniform DIF analysis" is an alternative to "differential category function". This can be seen by plotting the empirical ICCs for the item both groups.
uve December 9th, 2013, 11:13pm:
Mike,
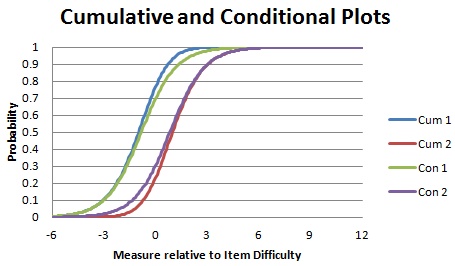
As I understand it, the conditional curves treat the categories as dichotomies, so the theta location where there is a 50/50 chance of being observed in that category or not.
As I understand it, the cumulative curves are the point of being observed in a category or any others below versus the category above.
However, whenever I switch between them, they both point to the same location on the scale. I thought perhaps there was something about my own data that was off and so used the Liking For Science data and it too did not change.
Perhaps I am not fully understanding the difference, but it would seem to me that these two different analyses should be giving very different information about the scale.
Mike.Linacre: Uve, please help me see the situation. In the analysis of Example0.txt, what changes to the control file have you made? What output Tables or Graphs are you looking at?
uve: I have made no changes to the control file. I just used Example0 as is. I then simply selected the Cumulative and Conditional options in the graph. Switching back and forth between them yields virtually no difference. I've done this with several other datasets and I always seem to get the same thing. I would rather use actual data for comparison, but the conditional probabilities are not included in the ISFILE output.
Mike.Linacre:
Uve, are we looking at the same Graphs? I flipped the Cumulative Graph, and then plotted it together with the Conditional Graph using Excel. Notice that the conditional curves are parallel dichotomous logistic ogives.
uve:
Thanks Mike. Yes, I was looking at the same thing. However, I was focusing only on the .5 probability point and did not notice any significant shift on the theta scale regardless of which datasets, including example0, I was using. Now that you have flipped the cumulative graphs, I see the difference and it seems to be primarily confined to points above and below the lines.
So if I am reading this correctly, from the conditional standpoint at roughly about zero on the scale, there is about an 80% probability of being observed at Neutral versus 20% not (Dislike).
At that same ability point from the cumulative perspective there is roughly a 90% of being observed at Dislike versus 10% in any category above.
Would that be close?
Mike.Linacre: Your eyesight is probably better than mine, Uve, but we can see the same thing by looking at the Category Probability Curves. "Conditional" compares adjacent curves. "Cumulative" compares all the curves, split high-low.
uve:
This is interesting and something I had not noticed before. It has always been my understanding that the Andrich Thresholds represented by where the adjacent category curves intersect mean equal probability, but that does not have to mean 50/50. It could be 30/30 or 60/60, etc. I think I have that right.
However, it appears that the conditional curves "convert" these points to 50/50. At least that's what my datasets seem to suggest. So I guess I'm a bit confused as to what is meant by "conditional".
Also, how would I interpret, say, .75 on the conditional curve?
Mike.Linacre:
Uve, "Conditional" means "conditional on looking only at the two adjacent categories". So .75 means: "the higher category is 3 times as probable as the lower category of the pair of categories".
uve: So would it be safe to say these are not similar to the Threshold Characteristic Curves found in RUMM?
Mike.Linacre:
Uve, please provide a link to an image of "Threshold Characteristic Curves".
The most widely published polytomous curves are the "Category Probability Curves" in which the Andrich Thresholds are at the intersections of the probability curves of adjacent categories. These Andrich Thresholds are the locations where the conditional curves cross the .5 probability line.
uve:
Virtually all of the TCC's I've seen have been in print. "Distractors with Information in Multiple Choice Items: A Rationale Based on the Rasch Model", Andrich & Styles, Criterion Referenced Testing, 2009 JAM Press is one example.
Mike.Linacre:
Thank you for the reference, Uve.
In the reference, these seem to be equivalent:
Fig. 1: Theoretical ICC = (Winsteps) Model ICC
(matching) Observed proportions = (Winsteps) Empirical ICC
Fig. 3: Category characteristic curves CCC = (Winsteps) Category probability curves
Fig. 5: Latent ICC = (Winsteps) Conditional ICC
(matching) Observed proportions = (Winsteps) not reported
Threshold probability curve = (Winsteps) Conditional ICC
Fig. 7a: Distractor proportions = (Winsteps) Empirical option curves
Fig. 7d: Threshold characteristic curve TCC = (Winsteps) Conditional ICC
Fig. 12: Person-item threshold distribution = (Winsteps) Table 1.7 Item Map with Andrich Thresholds
uve: Thanks for verifying!
ffwang December 7th, 2013, 10:41am:
Hi Mike,
I am using Facets to calibrate item parameters and ability scores. I learned in my class that we can code missing data in several ways, in my case, I used missing=999. As the test design I have is common item design with unique items on each form (2 forms I have), so part of the items on form 1 is not reached by examinees who take form 2, vice versa. So my question is, in Facets, how should I distinguish the coding of two different missing: one is missing in real sense, the other is not reached actually. Do I have to consider scoring them differently in terms of item or theta calibrations as I read somewhere in Winstep?
Thanks, Fan
Mike.Linacre:
Fan, you can use two different data codes in Facets: any values that are not valid responses. Missing (=skipped) and "Not reached" are coded differently when they are to be analyzed differently. For instance, on most multiple-choice tests, "skipped" are scored as "wrong".
The scoring of "not reached" depends on the purpose of the analysis. If we want good estimates of item difficulty, then "not reached" is treated as "not administered". If "not reached" is scored as "wrong", the the latter items on the test are estimated to be more difficult than they really are.
So, a good approach for speed tests is:
Analysis 1: "Not reached" are analyzed as not administered. Item difficulties are estimated.
Analysis 2: "Not reached" are analyzed as wrong. Items are anchored at their difficulties from analysis 1. Person abilities are estimated.
ffwang:
Hi Mike, thank you very much for the detailed explanation.
I wrote the following two codes to run the two separate analysis in order to get accurate item difficulty estimates and ability estimates. I have two types of missing data treating differently in terms of scoring. One is missing/skipped, scored as 0; the other one is missing/not administered, I guess those items will be scored as -1. First I used the following code to estimate item parameter, but it has been running the whole afternoon and is still running but didn't converge (not sure if this is the right word in this case). Can you help me take a look at my code to see if I did anything wrong? Thanks.
My codes for estimating item difficulty:
; item parameter calibrations
CODES=01S
NEWSCORE=010 ; S, skipped, is scored 0
MISSING-SCORED= -1 ; data code R is not in CODES= so it will be scored -1 = "ignore", "not administered"
IFILE=item-calibrations.txt
Output = SKTOUT1.txt
Title = AP Biology scientific knowledge for teaching Pilot items ;
Arrange = N
Facets = 2 ; four facets: examinees and items
Positive = 1 ; for facet 1, examinees, higher score = higher measure
Noncenter = 1 ; only facet 1, examinees, does not have mean measure set to zero
Pt-biserial = Yes ; report the point-biserial correlation
Vertical=1*, 2A ; show examinee by distribution, items by number and name
Model = ?,?,D ; elements of the two facets interact to produce dichotomous responses
Labels =
1,Examinees ; examinees are facet 1
1-196
*
2,items
1-63
*
Data=
1,1-63,0,1,1,1,1,1,1,0,1,1,0,1,0,1,0,1,1,1,1,1,1,1,1,1,1,0,1,0,0,1,0,0,1,0,1,1,1,1,1,1,R,R,R,R,R,R,R,R,R,R,R,R,R,R,R,R,R,R,R,R,R,R,R
2,1-63,S,S,S,S,S,S,S,S,S,S,S,S,S,S,S,S,S,1,1,1,1,1,1,1,1,S,S,S,S,S,S,S,S,S,S,S,1,1,1,1,R,R,R,R,R,R,R,R,R,R,R,R,R,R,R,R,R,R,R,R,R,R,R
3,1-63,0,0,1,1,0,0,1,0,1,1,1,1,0,1,1,1,1,1,1,1,1,1,1,1,1,0,1,0,0,1,1,1,1,1,1,1,1,1,1,1,R,R,R,R,R,R,R,R,R,R,R,R,R,R,R,R,R,R,R,R,R,R,R
4,1-63,0,1,1,0,0,0,1,1,1,1,1,1,1,1,0,1,1,1,1,1,1,1,1,1,1,0,1,0,0,1,1,1,0,0,1,1,1,1,1,1,R,R,R,R,R,R,R,R,R,R,R,R,R,R,R,R,R,R,R,R,R,R,R
5,1-63,0,1,0,0,0,0,0,0,0,0,1,0,0,1,0,1,1,1,1,1,1,1,1,1,1,0,0,1,0,0,0,1,1,1,1,0,1,1,1,1,R,R,R,R,R,R,R,R,R,R,R,R,R,R,R,R,R,R,R,R,R,R,R
6,1-63,0,0,1,0,1,1,1,0,1,1,1,1,0,0,0,1,1,1,1,1,1,1,1,1,1,0,1,1,0,0,0,0,0,0,1,0,1,1,1,1,R,R,R,R,R,R,R,R,R,R,R,R,R,R,R,R,R,R,R,R,R,R,R
7,1-63,S,S,S,S,S,S,S,S,S,S,S,S,S,S,S,S,S,1,1,1,1,1,1,1,0,S,S,S,S,S,S,S,S,S,S,S,1,1,1,1,R,R,R,R,R,R,R,R,R,R,R,R,R,R,R,R,R,R,R,R,R,R,R
8,1-63,0,0,1,1,0,0,1,0,1,1,1,1,0,1,1,1,1,1,1,1,1,1,1,1,1,1,0,1,0,1,0,0,1,1,1,0,1,1,1,1,R,R,R,R,R,R,R,R,R,R,R,R,R,R,R,R,R,R,R,R,R,R,R
9,1-63,0,1,0,1,1,1,1,0,0,1,0,1,0,1,0,0,1,1,1,1,1,1,1,1,1,1,1,0,0,0,0,0,0,0,0,0,1,1,1,1,R,R,R,R,R,R,R,R,R,R,R,R,R,R,R,R,R,R,R,R,R,R,R
10,1-63,1,0,1,1,0,0,1,0,1,1,0,1,1,1,0,0,1,1,1,1,1,1,1,1,1,1,0,0,0,1,0,0,0,0,0,0,1,1,1,1,R,R,R,R,R,R,R,R,R,R,R,R,R,R,R,R,R,R,R,R,R,R,R
11,1-63,0,0,1,1,1,0,1,0,1,1,1,1,1,1,0,1,1,1,1,1,1,1,1,1,0,1,1,0,0,1,1,1,0,1,0,0,1,1,1,1,R,R,R,R,R,R,R,R,R,R,R,R,R,R,R,R,R,R,R,R,R,R,R
12,1-63,0,0,1,0,0,0,1,1,0,1,0,1,0,1,1,1,1,1,1,1,1,1,1,1,1,0,1,0,1,1,1,1,1,1,1,0,1,1,1,1,R,R,R,R,R,R,R,R,R,R,R,R,R,R,R,R,R,R,R,R,R,R,R
13,1-63,1,1,1,1,1,0,1,0,1,1,1,1,0,1,1,1,1,1,1,1,1,1,1,1,1,0,1,0,0,1,0,0,1,1,0,1,1,1,1,1,R,R,R,R,R,R,R,R,R,R,R,R,R,R,R,R,R,R,R,R,R,R,R
14,1-63,0,1,1,0,1,0,1,0,1,1,1,1,0,1,1,1,1,1,1,1,1,1,1,1,1,1,1,1,0,0,1,1,0,1,1,1,1,1,1,1,R,R,R,R,R,R,R,R,R,R,R,R,R,R,R,R,R,R,R,R,R,R,R
..............................................
So for estimating ability, my code is as follows. But I didn't get a chance to run it because I do not have the accurate item difficulty parameter estimates.
; ability parameter calibrations
IAFILE=item-calibrations.txt
CODES=01SR
NEWSCORE=0100 ; S and R are scored 0
Output = SKTOUT2.txt
Title = AP Biology scientific knowledge for teaching Pilot items ;
Arrange = N
Facets = 2 ; four facets: examinees and items
Positive = 1 ; for facet 1, examinees, higher score = higher measure
Noncenter = 1 ; only facet 1, examinees, does not have mean measure set to zero
Pt-biserial = Yes ; report the point-biserial correlation
Vertical=1*, 2A ; show examinee by distribution, items by number and name
Model = ?,?,D ; elements of the two facets interact to produce dichotomous responses
Labels =
1,Examinees ; examinees are facet 1
1-196
*
2,items
1-63
*
Data=
1,1-63,0,1,1,1,1,1,1,0,1,1,0,1,0,1,0,1,1,1,1,1,1,1,1,1,1,0,1,0,0,1,0,0,1,0,1,1,1,1,1,1,R,R,R,R,R,R,R,R,R,R,R,R,R,R,R,R,R,R,R,R,R,R,R
2,1-63,S,S,S,S,S,S,S,S,S,S,S,S,S,S,S,S,S,1,1,1,1,1,1,1,1,S,S,S,S,S,S,S,S,S,S,S,1,1,1,1,R,R,R,R,R,R,R,R,R,R,R,R,R,R,R,R,R,R,R,R,R,R,R
3,1-63,0,0,1,1,0,0,1,0,1,1,1,1,0,1,1,1,1,1,1,1,1,1,1,1,1,0,1,0,0,1,1,1,1,1,1,1,1,1,1,1,R,R,R,R,R,R,R,R,R,R,R,R,R,R,R,R,R,R,R,R,R,R,R
4,1-63,0,1,1,0,0,0,1,1,1,1,1,1,1,1,0,1,1,1,1,1,1,1,1,1,1,0,1,0,0,1,1,1,0,0,1,1,1,1,1,1,R,R,R,R,R,R,R,R,R,R,R,R,R,R,R,R,R,R,R,R,R,R,R
5,1-63,0,1,0,0,0,0,0,0,0,0,1,0,0,1,0,1,1,1,1,1,1,1,1,1,1,0,0,1,0,0,0,1,1,1,1,0,1,1,1,1,R,R,R,R,R,R,R,R,R,R,R,R,R,R,R,R,R,R,R,R,R,R,R
6,1-63,0,0,1,0,1,1,1,0,1,1,1,1,0,0,0,1,1,1,1,1,1,1,1,1,1,0,1,1,0,0,0,0,0,0,1,0,1,1,1,1,R,R,R,R,R,R,R,R,R,R,R,R,R,R,R,R,R,R,R,R,R,R,R
7,1-63,S,S,S,S,S,S,S,S,S,S,S,S,S,S,S,S,S,1,1,1,1,1,1,1,0,S,S,S,S,S,S,S,S,S,S,S,1,1,1,1,R,R,R,R,R,R,R,R,R,R,R,R,R,R,R,R,R,R,R,R,R,R,R
8,1-63,0,0,1,1,0,0,1,0,1,1,1,1,0,1,1,1,1,1,1,1,1,1,1,1,1,1,0,1,0,1,0,0,1,1,1,0,1,1,1,1,R,R,R,R,R,R,R,R,R,R,R,R,R,R,R,R,R,R,R,R,R,R,R
9,1-63,0,1,0,1,1,1,1,0,0,1,0,1,0,1,0,0,1,1,1,1,1,1,1,1,1,1,1,0,0,0,0,0,0,0,0,0,1,1,1,1,R,R,R,R,R,R,R,R,R,R,R,R,R,R,R,R,R,R,R,R,R,R,R
10,1-63,1,0,1,1,0,0,1,0,1,1,0,1,1,1,0,0,1,1,1,1,1,1,1,1,1,1,0,0,0,1,0,0,0,0,0,0,1,1,1,1,R,R,R,R,R,R,R,R,R,R,R,R,R,R,R,R,R,R,R,R,R,R,R
11,1-63,0,0,1,1,1,0,1,0,1,1,1,1,1,1,0,1,1,1,1,1,1,1,1,1,0,1,1,0,0,1,1,1,0,1,0,0,1,1,1,1,R,R,R,R,R,R,R,R,R,R,R,R,R,R,R,R,R,R,R,R,R,R,R
12,1-63,0,0,1,0,0,0,1,1,0,1,0,1,0,1,1,1,1,1,1,1,1,1,1,1,1,0,1,0,1,1,1,1,1,1,1,0,1,1,1,1,R,R,R,R,R,R,R,R,R,R,R,R,R,R,R,R,R,R,R,R,R,R,R
13,1-63,1,1,1,1,1,0,1,0,1,1,1,1,0,1,1,1,1,1,1,1,1,1,1,1,1,0,1,0,0,1,0,0,1,1,0,1,1,1,1,1,R,R,R,R,R,R,R,R,R,R,R,R,R,R,R,R,R,R,R,R,R,R,R
14,1-63,0,1,1,0,1,0,1,0,1,1,1,1,0,1,1,1,1,1,1,1,1,1,1,1,1,1,1,1,0,0,1,1,0,1,1,1,1,1,1,1,R,R,R,R,R,R,R,R,R,R,R,R,R,R,R,R,R,R,R,R,R,R,R
15,1-63,0,0,0,0,0,0,1,0,0,1,1,1,0,1,1,0,1,1,1,1,1,1,1,1,1,0,0,1,0,1,0,0,0,1,0,0,1,1,1,1,R,R,R,R,R,R,R,R,R,R,R,R,R,R,R,R,R,R,R,R,R,R,R
16,1-63,0,1,1,1,0,0,1,0,1,1,0,1,1,1,0,1,1,1,1,1,1,1,1,1,1,0,1,1,1,1,1,0,0,0,1,1,1,1,1,1,R,R,R,R,R,R,R,R,R,R,R,R,R,R,R,R,R,R,R,R,R,R,R
.................................
Thank you very much. Fan
Mike.Linacre:
Fan, these are Winsteps instructions:
CODES=01S
NEWSCORE=010 ; S, skipped, is scored 0
MISSING-SCORED= -1 ; data code R is not in CODES= so it will be scored -1 = "ignore", "not administered"
and
IAFILE=item-calibrations.txt
CODES=01SR
NEWSCORE=0100 ; S and R are scored 0
For Facets,
response scoring: use Rating scale=
anchoring: use Labels= and ,A for the anchored facet.
ffwang:
Hi Mike,
Thank you for pointing this out. I used Winstep codes only because I couldn't find out how to code missing data in Facets manuals.
I think I am still confused about the right codes to use and I tried but found my codes might be problematic. Could you help me take a look? Thank you.
Analysis 1: estimating item parameters
; item parameter calibrations
Output = SKTOUT1.txt
Title = AP Biology scientific knowledge for teaching Pilot items ;
;Arrange = A
Facets = 2 ; two facets: examinees and items
Positive = 1 ; for facet 1, examinees, higher score = higher measure
Noncenter = 1 ; only facet 1, examinees, does not have mean measure set to zero
Pt-biserial = Yes ; report the point-biserial correlation
Vertical=1*,1A, 2A ; show examinee by distribution, label,items by label
Model = ?,?,D ; elements of the two facets interact to produce dichotomous responses
Rating scale=recoded, D ; a dichotomous scale called "recoded"
0=wrong,,,S ;S recoded to 0
-1=missing,,,R ; R recoded to be ignored
*
Labels =
1,Examinees ; examinees are facet 1
1-196
*
2,items
1-63
*
Data=
..............................................
Analysis 2: estimating ability parameter
; ability parameter calibrations
Output = SKTOUT2.txt
Title = AP Biology scientific knowledge for teaching Pilot items ;
;Arrange = A
Facets = 2 ; two facets: examinees and items
Positive = 1 ; for facet 1, examinees, higher score = higher measure
Noncenter = 1 ; only facet 1, examinees, does not have mean measure set to zero
Pt-biserial = Yes ; report the point-biserial correlation
Vertical=1*,1A, 2A ; show examinee by distribution, label,items by label
Model = ?,?,D ; elements of the two facets interact to produce dichotomous responses
Rating scale=recoded, D ; a dichotomous scale called "recoded"
0=wrong,,,S+R ;SR recoded to 0
;-1=missing,,,R ; R recoded to be ignored
*
Labels =
1,Examinees ; examinees are facet 1
1-196
*
2=items,A ; anchored facet
1-63
*
Data=
.......................................
Three problems:
1. I used "Rating scale=recoded, D", but the output gave me a warning "Rating (or other) scale = RECODED,D,General,Ordinal Warning (3)! This Rating (or partial credit) scale= is NOT referenced by a Model= specification" And it makes sense to me because I remembered I only use "rating scale=" for rating scale or partial credit model in Facets. So I guess I must did something wrong.
2. As you might or might not notice, I recoded not administered items differently in the two analyses, but the output are identical, which doesn't seem to be right to me.
3. For anchoring, I never used it before and I anchored items the way I consulted in the manual, is that right? As I only made two changes to the codes for ability estimates, one for recoding "not administered" as wrong, 0, the other is anchoring "item parameter estimates", so maybe I need a input file for the item parameters I got from previous run, then how?
Thank a lot. Fan
Mike.Linacre:
You are making progress, Fan.
1. Any code in the data that is not valid for your Model= is a missing data code.
Your model is
Model = ?,?,D
"D" expects the data to be 0 and 1. Anything else such as S or R or 2 is a missing data code.
2. Activate the Rating scale= in the Model= specification:
Model = ?,?,recoded ; elements of the two facets interact to produce dichotomous responses
Rating scale=recoded, D ; a dichotomous scale called "recoded"
0=wrong,,,S ;S recoded to 0
*
3. The second analysis is easier if you write an Anchorfile= from the first analysis, so the first analysis is:
; Analysis 1: estimating item parameters
; item parameter calibrations
Output = SKTOUT1.txt
Anchorfile=SKTOUT1.anc.txt
Title = AP Biology scientific knowledge for teaching Pilot items ;
;Arrange = A
Facets = 2 ; two facets: examinees and items
Positive = 1 ; for facet 1, examinees, higher score = higher measure
Noncenter = 1 ; only facet 1, examinees, does not have mean measure set to zero
Pt-biserial = Yes ; report the point-biserial correlation
Vertical=1*,1A, 2A ; show examinee by distribution, label,items by label
Model = ?,?,recoded ; elements of the two facets interact to produce dichotomous responses
Rating scale=recoded, D ; a dichotomous scale called "recoded"
0=wrong,,,S ;S recoded to 0
*
Labels =
1,Examinees ; examinees are facet 1
1-196
*
2,items
1-63
*
Data=
1,1-63,0,1,1,1,1,1,1,0,1,1,0,1,0,1,0,1,1,1,1,1,1,1,1,1,1,0,1,0,0,1,0,0,1,0,1,1,1,1,1,1,R,R,R,R,R,R,R,R,R,R,R,R,R,R,R,R,R,R,R,R,R,R,R
2,1-63,S,S,S,S,S,S,S,S,S,S,S,S,S,S,S,S,S,1,1,1,1,1,1,1,1,S,S,S,S,S,S,S,S,S,S,S,1,1,1,1,R,R,R,R,R,R,R,R,R,R,R,R,R,R,R,R,R,R,R,R,R,R,R
3,1-63,0,0,1,1,0,0,1,0,1,1,1,1,0,1,1,1,1,1,1,1,1,1,1,1,1,0,1,0,0,1,1,1,1,1,1,1,1,1,1,1,R,R,R,R,R,R,R,R,R,R,R,R,R,R,R,R,R,R,R,R,R,R,R
4,1-63,0,1,1,0,0,0,1,1,1,1,1,1,1,1,0,1,1,1,1,1,1,1,1,1,1,0,1,0,0,1,1,1,0,0,1,1,1,1,1,1,R,R,R,R,R,R,R,R,R,R,R,R,R,R,R,R,R,R,R,R,R,R,R
5,1-63,0,1,0,0,0,0,0,0,0,0,1,0,0,1,0,1,1,1,1,1,1,1,1,1,1,0,0,1,0,0,0,1,1,1,1,0,1,1,1,1,R,R,R,R,R,R,R,R,R,R,R,R,R,R,R,R,R,R,R,R,R,R,R
6,1-63,0,0,1,0,1,1,1,0,1,1,1,1,0,0,0,1,1,1,1,1,1,1,1,1,1,0,1,1,0,0,0,0,0,0,1,0,1,1,1,1,R,R,R,R,R,R,R,R,R,R,R,R,R,R,R,R,R,R,R,R,R,R,R
7,1-63,S,S,S,S,S,S,S,S,S,S,S,S,S,S,S,S,S,1,1,1,1,1,1,1,0,S,S,S,S,S,S,S,S,S,S,S,1,1,1,1,R,R,R,R,R,R,R,R,R,R,R,R,R,R,R,R,R,R,R,R,R,R,R
8,1-63,0,0,1,1,0,0,1,0,1,1,1,1,0,1,1,1,1,1,1,1,1,1,1,1,1,1,0,1,0,1,0,0,1,1,1,0,1,1,1,1,R,R,R,R,R,R,R,R,R,R,R,R,R,R,R,R,R,R,R,R,R,R,R
9,1-63,0,1,0,1,1,1,1,0,0,1,0,1,0,1,0,0,1,1,1,1,1,1,1,1,1,1,1,0,0,0,0,0,0,0,0,0,1,1,1,1,R,R,R,R,R,R,R,R,R,R,R,R,R,R,R,R,R,R,R,R,R,R,R
10,1-63,1,0,1,1,0,0,1,0,1,1,0,1,1,1,0,0,1,1,1,1,1,1,1,1,1,1,0,0,0,1,0,0,0,0,0,0,1,1,1,1,R,R,R,R,R,R,R,R,R,R,R,R,R,R,R,R,R,R,R,R,R,R,R
11,1-63,0,0,1,1,1,0,1,0,1,1,1,1,1,1,0,1,1,1,1,1,1,1,1,1,0,1,1,0,0,1,1,1,0,1,0,0,1,1,1,1,R,R,R,R,R,R,R,R,R,R,R,R,R,R,R,R,R,R,R,R,R,R,R
12,1-63,0,0,1,0,0,0,1,1,0,1,0,1,0,1,1,1,1,1,1,1,1,1,1,1,1,0,1,0,1,1,1,1,1,1,1,0,1,1,1,1,R,R,R,R,R,R,R,R,R,R,R,R,R,R,R,R,R,R,R,R,R,R,R
13,1-63,1,1,1,1,1,0,1,0,1,1,1,1,0,1,1,1,1,1,1,1,1,1,1,1,1,0,1,0,0,1,0,0,1,1,0,1,1,1,1,1,R,R,R,R,R,R,R,R,R,R,R,R,R,R,R,R,R,R,R,R,R,R,R
14,1-63,0,1,1,0,1,0,1,0,1,1,1,1,0,1,1,1,1,1,1,1,1,1,1,1,1,1,1,1,0,0,1,1,0,1,1,1,1,1,1,1,R,R,R,R,R,R,R,R,R,R,R,R,R,R,R,R,R,R,R,R,R,R,R
15,1-63,0,0,0,0,0,0,1,0,0,1,1,1,0,1,1,0,1,1,1,1,1,1,1,1,1,0,0,1,0,1,0,0,0,1,0,0,1,1,1,1,R,R,R,R,R,R,R,R,R,R,R,R,R,R,R,R,R,R,R,R,R,R,R
16,1-63,0,1,1,1,0,0,1,0,1,1,0,1,1,1,0,1,1,1,1,1,1,1,1,1,1,0,1,1,1,1,1,0,0,0,1,1,1,1,1,1,R,R,R,R,R,R,R,R,R,R,R,R,R,R,R,R,R,R,R,R,R,R,R
.................................
Mike.Linacre:
Fan, now for the second analysis.
Edit the anchorfile output of the first analysis,
1. Remove the ,A for the Examinees
2. Recode R to wrong
; Analysis 2: estimating Examinee abilities
;Output = SKTOUT1.txt
;Anchorfile=SKTOUT1.anc.txt
Title = AP Biology scientific knowledge for teaching Pilot items ;
Facets = 2 ; two facets: examinees and items
Positive = 1 ; for facet 1, examinees, higher score = higher measure
Noncenter = 1 ; only facet 1, examinees, does not have mean measure set to zero
Pt-biserial = Yes ; report the point-biserial correlation
Vertical=1*,1A, 2A ; show examinee by distribution, label,items by label
Models =
?,?,RS1,1 ; RECODED
*
Rating (or partial credit) scale = RS1,D,G,O ; RECODED
0=wrong,1,A,S+R ; add R here
*
Labels =
1,Examinees ; remove A from here
1=1,.8224688 ; you can leave these values. They are not anchored.
2=2,-4.642145
3=3,1.244645
.....
*
2,items,A
1=1,2.492652 ; these values are anchored
2=2,.55114
3=3,-.8945987
......
*
Data=
1,1-63,0,1,1,1,1,1,1,0,1,1,0,1,0,1,0,1,1,1,1,1,1,1,1,1,1,0,1,0,0,1,0,0,1,0,1,1,1,1,1,1,R,R,R,R,R,R,R,R,R,R,R,R,R,R,R,R,R,R,R,R,R,R,R
2,1-63,S,S,S,S,S,S,S,S,S,S,S,S,S,S,S,S,S,1,1,1,1,1,1,1,1,S,S,S,S,S,S,S,S,S,S,S,1,1,1,1,R,R,R,R,R,R,R,R,R,R,R,R,R,R,R,R,R,R,R,R,R,R,R
3,1-63,0,0,1,1,0,0,1,0,1,1,1,1,0,1,1,1,1,1,1,1,1,1,1,1,1,0,1,0,0,1,1,1,1,1,1,1,1,1,1,1,R,R,R,R,R,R,R,R,R,R,R,R,R,R,R,R,R,R,R,R,R,R,R
4,1-63,0,1,1,0,0,0,1,1,1,1,1,1,1,1,0,1,1,1,1,1,1,1,1,1,1,0,1,0,0,1,1,1,0,0,1,1,1,1,1,1,R,R,R,R,R,R,R,R,R,R,R,R,R,R,R,R,R,R,R,R,R,R,R
5,1-63,0,1,0,0,0,0,0,0,0,0,1,0,0,1,0,1,1,1,1,1,1,1,1,1,1,0,0,1,0,0,0,1,1,1,1,0,1,1,1,1,R,R,R,R,R,R,R,R,R,R,R,R,R,R,R,R,R,R,R,R,R,R,R
6,1-63,0,0,1,0,1,1,1,0,1,1,1,1,0,0,0,1,1,1,1,1,1,1,1,1,1,0,1,1,0,0,0,0,0,0,1,0,1,1,1,1,R,R,R,R,R,R,R,R,R,R,R,R,R,R,R,R,R,R,R,R,R,R,R
7,1-63,S,S,S,S,S,S,S,S,S,S,S,S,S,S,S,S,S,1,1,1,1,1,1,1,0,S,S,S,S,S,S,S,S,S,S,S,1,1,1,1,R,R,R,R,R,R,R,R,R,R,R,R,R,R,R,R,R,R,R,R,R,R,R
8,1-63,0,0,1,1,0,0,1,0,1,1,1,1,0,1,1,1,1,1,1,1,1,1,1,1,1,1,0,1,0,1,0,0,1,1,1,0,1,1,1,1,R,R,R,R,R,R,R,R,R,R,R,R,R,R,R,R,R,R,R,R,R,R,R
9,1-63,0,1,0,1,1,1,1,0,0,1,0,1,0,1,0,0,1,1,1,1,1,1,1,1,1,1,1,0,0,0,0,0,0,0,0,0,1,1,1,1,R,R,R,R,R,R,R,R,R,R,R,R,R,R,R,R,R,R,R,R,R,R,R
10,1-63,1,0,1,1,0,0,1,0,1,1,0,1,1,1,0,0,1,1,1,1,1,1,1,1,1,1,0,0,0,1,0,0,0,0,0,0,1,1,1,1,R,R,R,R,R,R,R,R,R,R,R,R,R,R,R,R,R,R,R,R,R,R,R
11,1-63,0,0,1,1,1,0,1,0,1,1,1,1,1,1,0,1,1,1,1,1,1,1,1,1,0,1,1,0,0,1,1,1,0,1,0,0,1,1,1,1,R,R,R,R,R,R,R,R,R,R,R,R,R,R,R,R,R,R,R,R,R,R,R
12,1-63,0,0,1,0,0,0,1,1,0,1,0,1,0,1,1,1,1,1,1,1,1,1,1,1,1,0,1,0,1,1,1,1,1,1,1,0,1,1,1,1,R,R,R,R,R,R,R,R,R,R,R,R,R,R,R,R,R,R,R,R,R,R,R
13,1-63,1,1,1,1,1,0,1,0,1,1,1,1,0,1,1,1,1,1,1,1,1,1,1,1,1,0,1,0,0,1,0,0,1,1,0,1,1,1,1,1,R,R,R,R,R,R,R,R,R,R,R,R,R,R,R,R,R,R,R,R,R,R,R
14,1-63,0,1,1,0,1,0,1,0,1,1,1,1,0,1,1,1,1,1,1,1,1,1,1,1,1,1,1,1,0,0,1,1,0,1,1,1,1,1,1,1,R,R,R,R,R,R,R,R,R,R,R,R,R,R,R,R,R,R,R,R,R,R,R
15,1-63,0,0,0,0,0,0,1,0,0,1,1,1,0,1,1,0,1,1,1,1,1,1,1,1,1,0,0,1,0,1,0,0,0,1,0,0,1,1,1,1,R,R,R,R,R,R,R,R,R,R,R,R,R,R,R,R,R,R,R,R,R,R,R
16,1-63,0,1,1,1,0,0,1,0,1,1,0,1,1,1,0,1,1,1,1,1,1,1,1,1,1,0,1,1,1,1,1,0,0,0,1,1,1,1,1,1,R,R,R,R,R,R,R,R,R,R,R,R,R,R,R,R,R,R,R,R,R,R,R
............................
ffwang:
Hi Mike,
Thank you very much for the detailed guidance. You are awesome!!!
I think I get the output pretty much, but I have several questions that I do not understand. Sorry for keeping bugging you. :-) This is my first time using Facets on dichotomous items. I used Facets mostly for polytomous/Likert-type items.
1, I found out that for the "not administered" item responses, whether recode it to be "-1" or not, the outputs are the same. So can I make the generalization that if I want to ignore any item response (one way to handle "not reached" item responses), just use any other code that I didn't specify in the syntax command. The logic is that if something is not specified in the syntax, Facets will ignore it. In addition, in the model summary, the code R I used to code "not administered" item response is not included in either of the two response categories (0,1). Did I do anything wrong? Should I add the code "-1=missing,,,R ; R recoded to be ignored" to recode the "not administered" item responses. "
2. I didn't quite get the model specification you recommended, particularly when I examined the output. And there is a warning too in my output:
Analysis 1:
"Check (2)? Invalid datum location: 1,41,R in line 24. Datum "R" is too big or not a positive integer, treated as missing.
Total lines in data file = 197
Total data lines = 196
Responses matched to model: ?,?,RECODED,1 = 12348
Total non-blank responses found = 12348"
Analysis 2:
"Total lines in data file = 197
Total data lines = 196
Responses matched to model: ?,?,RS1,1 = 12348
Total non-blank responses found = 12348"
As my item responses are only 0's and 1's, I do not understand why there are 1,2,3,4,8 because I didn't recode the 0's and 1's to be any number as indicated in the output.
3. for the model for analysis 2,
"Model = ?,?,RS1,1 ; recoded
Rating (or partial credit) scale=RS1, D, G, O ; G means all general, sharing the same scale
0=wrong,1, A,S+R ;SR recoded to 0"
I checked out what "G" means, but why we need the "O" here? I couldn't find it out in the manual.
In addition, why "1" is also coded to be 0?
Does "A" refer to the anchored item parameters? Why we want to recode them to be 0?
4. I checked out the reliability estimates and I expected the reliability estimates should be the same for items for both analysis, but they are different. I understand the reliability estimates as index of separation and I thought the separation indices should be the same in both analysis because they are the same items and with the same test takers.
E.g.,
for 1st analysis, reliability for items = 0.90
for 2nd analysis, reliability for items = 0.83
for 1st analysis, reliability for examinees = 0.80
for 2nd analysis, reliability for examinees = 0.87
5. A side question. To interpret fit, we are mostly worried about InFit/OutFit > 1.2. If all the codes I used are correct, it seems to me most of the items and persons are not fitting well. Are there any other fit statistics that I can use in Facets to help interpret the results? How should I interpret the item discrimination for each item?
Thank you very much!
Mike.Linacre:
Fan, please look through the Facets tutorials at www.winsteps.com/tutorials.htm - also there is a huge amount of material in the Facets Help file and in the books about Facets.
1. All invalid responses such as -1 and R are ignored by Facets. Recoding R into -1 is recoding one invalid response to become another.
2. "Check (2)? Invalid datum location:
Facets alerts you about invalid data values in case they are data-entry errors. Invalid data are ignored.
3. Total non-blank responses found = 12348" = twelve thousand three hundred and forty-eight responses in the data file.
O = Ordinal (the default)
4. Different data analyzed = different reliabilities.
5. 1.2 is an exceedingly tight fit. See "Reasonable Mean-Square Fit Statistics" - https://www.rasch.org/rmt/rmt83b.htm -
For this data design with low control over the data, high mean-squares are expected.
ffwang: You are my life saver and thank you very much, Mike. Your responses are very helpful and the links too. I understand my questions now and laughed at myself for the "12348" because I was all worried about "responses being wrongly recoded but ignored the fact that it's actually about the counts of the responses". You are the best and Facets is the best too!!!
ffwang:
Hi Mike, I think I still have a question.
As you said the two separate analysis are good for speeded tests (or maybe tests that are potentially speeded), I was thinking if my test is not speeded, so I should not run two separate analyses, right?
My test is a common item design: 25 unique items on form A, 20 common items, and 25 unique items on form B, this is why part of the items are not administered to the examinees who took either form A or form B. So I think as long as I coded the items that were not administered correctly, I do not have to run the second analysis to estimate ability estimates, right?
Thank you.
Mike.Linacre:
Correct, Fan. The first analysis is enough for both examinees and items.
ffwang: Thank you very much! I will express my gratitude to you in front of my professor as well. Without your help, I couldn't be able to get my project work done. Thanks again. Best, Fan :-)
ffwang December 7th, 2013, 10:49am: Hi Mike, I got an error message "Error F31 in line 23: Too many responses: excess: 60". I have 63 items to calibrate, so it will not work in Facets? Can Winstep take more than 60 items? Thanks!
Mike.Linacre:
Fan, this error message is for a data-entry error. The number of responses in the data line does not match the elements specified in the data line.
Facets can accept a huge number of responses in a data line, probably more than 32,000, but they must match the range of elements in the data line.
ffwang: Thank you Mike. I did forget something. :-)
bmallinc December 1st, 2013, 8:14pm:
Greetings WINSTEPS users.
I have a question regarding how to show two overlapping test information functions on the same plot. I have a scale with ten items selected using Rasch criteria from an item pool of 25 items. LetÆs call this the ōIRT subscaleö. I have identified the 10 items with highest factor loadings that would have been selected using CTT methods. There are six items in common for the IRT and CCT subscales, and four items unique to each scale. I have entered the 14 combined items in WINSTEPS. I would like to produce two test information plots on the same x-axis constructed from the 14 items, one plot for items 1-10, and a second plot for items 5-10.
Mike.Linacre:
Bmallinc, please use Excel to do this.
1) Run the 14 item analysis
2) Select items 1-10:
Specification menu box: IDELETE=+1-10
Verify that the correct items are selected: Output Tables: Table 14.
3) Output its TIF to Excel:
Output files menu: TCCFILE=, temporary to Excel
4) Reinstate all items
Specification menu box: IDELETE=
5) Select items 5-14:
Specification menu box: IDELETE=+5-14
Verify that the correct items are selected: Output Tables: Table 14.
6) Output its TIF to Excel:
Output files menu: TCCFILE=, temporary to Excel
There are now to Excel files each Excel file has a column of measures and a column of TIF.
Copy the Measure and TIF columns from one Excel file to the other
In the Excel worksheet with both TIF columns, scatter-plot each of the TIFs against its measures.
OK, bmallinc?
bmallinc:
Dr. Linacre,
Thank you so much for your reply. My mistake in the original post, the IRT items are 5-14, not 5-10. In any case, your suggestion worked very well. However, although the two TIF plots have different shapes, they seem to be centered at the same zero point -- that is, each appears to have it's own x-axis. Is there any way to plot both TFF curves on the same x-asix -- perhaps based on the full set of 14 items? The 10 IRT items were selected to provide better "bandwidth" within the 14-item set (+1.2 logits to -.90). The 10 CTT times are concentrated in the lower range of difficulty (+0.3 log its to -.90).
Mike.Linacre:
Bmallinc,
i) Please be sure you are only running one analysis: at step 1). Everything else is from the "Specification" menu box and the other menus.
ii) Be sure to copy both the TIF and ite Measure from one Excel spreadsheet to the other. (The instructions have been amended for this.)
bmallinc:
Dr. Linacre,
I apologize, but I do not see an option in the output files menu for TCCFILE, so instead I launch the graphics module, graph the TIF and then export the data to clipboard, once for items 1-10, then repeat for items 5-14. Please advise about how to access and export TCCFILE?
Thanks
Mike.Linacre:
BMallinc, TCCFILE= was added in Winsteps 3.80 (the current version), but TCC also works from the Graph dialog box.
Please verify at stages 2) and 5) that you have the correct items selected by Output Tables, Table 14.
Ramiel November 26th, 2013, 2:13pm:
Dear Experts,
I am very new to Facets in term of both using the software and its basic idea. I am using Minifac 3.71.3. My situation is that i have 100 students and 2 raters. The first 50 are rated by Rater 1, while the others are rated by Rater 2.
The error message is:
Error F36: All data eliminated as extreme. Dropped elements - first: facet 1 element 9 "9" - last: facet 1 element 99 "99"
Execution halted
I tried to consult help, but I can't find any mistake on y code.
Please help.
Ramiel Knight
ps my specification file is attached to this message.
Mike.Linacre:
Thank you for asking, Ramiel.
Your data are very thin. There is only one rating for each student and their is no overlap for the raters. In order for Rasch-model parameters to be estimated from these data, many constraints must be imposed.
In order to choose reasonable constraints, we need more information. What is the purpose of this data collection and analysis?
Ramiel:
Hi,
Thank you for your quick reply. I am dealing with a large scale marking involving 1500 students which are divided into 20 groups. Each group has 1 and only 1 lecturer and each lecturer marks only his/her students in his/her group.
Every student is assigned to complete exactly the same work, but different lecturers mark with different criteria even with the same marking scheme.
I am trying to minimise the bias/imbalance/inequality to make sure that the whole marking system is fair to the students.
Thank you very much,
Ramiel Knight
Mike.Linacre:
This is a tough situation, Ramiel. This is not really a Rasch analysis.
The best we can probably say is "the 20 groups of students are randomly equivalent" (assuming that students are assigned to the groups effectively at random).
Then we can adjust for differences in lecturer severity and central tendency:
1) compute the overall mean (M) and S.D. (SD) of all the ratings.
2) compute for each group its group mean (GM) and group S.D. (GSD).
3) standardize all the groups to the overall mean and S.D.
Standardized rating for student = ((original rating for student - GM)/GSD)*SD + M
4) Half-round the standardized rating to make the reported "fair" rating.
Gathercole:
Hi Ramiel,
It wasn't clear from your message whether these student scores will factor into the students' actual grade or if you are just experimenting with the data, but if it's the former I would caution you NOT to adjust the student scores with a thin judging plan like the one you have.
Assuming the group abilities are equal is not defensible and there could be blowback if lecturers find out their students' grades were negatively impacted by the procedure.
On the other hand if you're just doing research, feel free to experiment with the analysis however you want :) But going forward, if you want to control for differences in rater severity, each student should be rated by at least two raters.
Mike.Linacre: Ramiel, ... and also at least two ratings of each student by each rater. Instead of one holistic rating, split the rating criteria into at least two "analytic" ratings.
Ramiel:
Thank you Gathercole and Mike for your useful suggestions,
I have been busy with something else for a few days. I just added one more facet to the calculation which is "item". My analysis comprises 3 problems (items) which every students must completes all 3 problems. I think this is equivalent to Mike's suggestion "split the rating criteria into at least two "analytic" ratings"). Unfortunately, each student is still rated by only one rater. The analysis is completed without error message.
I have one dumb question. Which method is more suitable for my situation between Rasch analysis and the standardised method ((original rating for student - GM)/GSD)*SD + M)?
Regards,
Ramiel
Mike.Linacre:
Ramiel, is this the design now?
Each student has 3 ratings, but groups of students are nested within rater?
If so, this can be successfully analyzed by Rasch, but a decision is needed:
a) are the groups of students randomly equivalent = same mean ability for every group?
or
b) are the raters equivalent = same leniency for every rater?
Unfortunately there is no information in the data for choosing between (a) or (b) or something else. The choice must be made based on information outside the data.
Ramiel:
All the students are randomly divided into groups, so I think I can assume that the average ability of every group is equivalent.
The raters are all different, and I think I cannot assume the equivalence of their leniency.
Mike.Linacre:
Ok, Ramiel.
Group-anchor the groups of students at the same logit value.
Facets can set up the group-anchors for you, see
www.winsteps.com/facetman/subsetanchorfile.htm
sjp December 3rd, 2013, 1:15am:
I've just run a small rating scale analysis using a trial version of winsteps, and have been left wondering how winsteps calculates the number of free parameters estimated when a null category is observed.
Winsteps appears to simply count the number of categories (including the null category) and subtract 2 to obtain the number of category parameters estimated. But given the null category does not have an estimated Rasch-Andrich threshold (presumably), should this category be discounted?
In the small rating scale analysis I've run, the summary statistics report a log-likelihood chi square with 361 degrees of freedom. However, my own calculations show it should be 362 based on the formula:
df = #data points used - # free parameters estimated
I have 406 data points (by both my count and as shown in the summary statistics), and have the following:
29 persons - none of which are extreme (thus 29 free person parameters)
14 items - none of which are extreme (thus 13 free item parameters)
4 observed categories discounting the null category (thus 2 free parameters for the Andrich thresholds)
which sums to 44 free parameters, meaning my total degrees of freedom should be 406 - 44 = 362 if the null category does not have an associated free parameter estimate.
Given that Winsteps reports 361 degrees of freedom and not 362, it appears to be counting the null category as having an associated parameter estimate (thus 3 free category parameters instead of 2, and thus one less degree of freedom).
Is this correct? or have I missed something somewhere? Should I take the 361 degrees of freedom Winsteps reports to be correct?
any help would be appreciated,
thanks
Mike.Linacre:
Thank you for your question, sjp. The d.f. reported by Winsteps are very approximate estimates. So (1) please investigate your data design carefully, and (2) you will almost certainly produce a better estimate of the d.f. In the next version of Winsteps, the d.f. will be shown as a range, not a point value.
For incidental null categories, Winsteps does estimate parameters. You can see them if you output the SFILE=. The Rasch model would estimate values at infinity. Winsteps substitutes values at around 40, which correspond to the most extreme values that some computers can calculate reliably.
If the null category should not have a parameter (because the zero is structural, not due to sampling), then please exclude the category from the estimation. One way is with STKEEP=No.
sjp:
Thanks very much Mike. My null category is incidental and it makes sense that the parameter would be estimated at infinity (or at the least a large number).
much appreciated!
acdwyer77 December 2nd, 2013, 4:33am:
I've been searching for an example of an anchor item file for polytomous items. It seems to me that one would need to specify more than just the overall item measure (i.e., Di in tutorial 3) in order to "fix" that item when future forms containing that item are calibrated. Wouldn't one also need to specify the category threshholds (i.e., all the Fij values) somehow?
I'd like to find an example of how this is done, if possible. Thanks!
Mike.Linacre:
Yes, acdwyer77, you are right. We need to anchor the thresholds ...
In Winsteps: IAFILE= and SAFILE=
www.winsteps.com/winman/safile.htm
Easiest way: output IFILE=if.txt and SFILE=sf.txt from a free analysis
then anchor with
IAFILE=if.txt
SAFILE=sf.txt
In Facets, Anchorfile=
www.winsteps.com/facetman/anchorfile.htm
acdwyer77: Perfect, thanks!
acdwyer77:
Ok, I took a look at the links above and at some output from example 12 in Tutorial 3, and I think I understand, but I just want to be absolutely sure before I start equating tests that have polytomous items.
If I have polytomous items and I want to anchor them at their estimated values, I need to use both IAFILE = if.txt and SAFILE = sf.txt, correct? If I only specify SAFILE, for example, then the item structure (relative threshold values) would be fixed, but the overall item difficulty would be freely estimated. Likewise, if I specify just the IAFILE, then the overall item difficulty would be fixed, but the structure would be freely estimated.
Could you confirm that this is, in fact, correct? Thanks again!
Mike.Linacre: Yes, that is exactly correct, acdwyer77.
acdwyer77: Thanks!
Elina November 21st, 2013, 9:28am:
Hello Mike
I'm a beginner in Facets interested in intra- and inter-rater judgements.
In general: How much data is enough? Is there some kind of minimum amount of datapoints? Tests are not high stake tests. If more data is needed, there are more test takers available.
And some examples:
A) 10-13 raters x 300 test takers x 20 new items (standard setting session; 10 anchor items already rated)
B) 10-13 raters x 15 test takers x 3 tasks (and maybe 4 criteria of assessment) (judges benchmarking writing performances)
C) 5 raters x ??? test takers x 1 task x 4 criteria of assessment (everyday assessment of speaking performances) BUT raters don't rate exactly same performances. How many test takers might be needed and how many shared performances should raters rate?
Elina
Mike.Linacre:
Elina,
Minimum: at least 30 ratings by every rater, and each rater should make at least 5 ratings also rated by another rater. But much more is better.
gleaner:
So shall we say that 2 raters, 5 rating each, 3 respondents, so 30 ratings for each respondent in total is the minimum statisfactory data for Facets analysis, the more data ( raters, ratings for each rater, more respondents, then the better.
Am I right? Thanks a lot, Dr Linacre! Sorry to interrupt!
Elina:
Thank you, Mike. If a test taker writes 3 essays, can I count that as 3 ratings?
Did I get this right: 5 raters might be enough?
Mike.Linacre:
Gleaner, Facets is happy with one rating, so we are not talking about Facets, we are talking about statistics. How much data is required for a statistical finding to be reasonably precise and reasonably robust against idiosyncrasies in the data? Generally, to be reasonably precise, we need at least 30 observations of each parameter. To be reasonably robust against idiosyncratic observations, we need at least 10 observations of each parameter. Of course, more data usually increases precision and robustness.
Gleaner and Elina, the amount of data (=number of ratings) is often limited by practical considerations. Judging is expensive. Performing is time-consuming. For instance, in Olympic Diving, each diver performs 6 dives that are rated by 7 judges, but the high and low judges are eliminated for each performance, so each diver has 6x5=30 ratings, which accidentally or deliberately just meets the statistical guideline.
Elina, for each test-taker, (number of essays) x (number of items on which an essay is rated) x (number of raters) = number of ratings
Example, each test-taker writes 3 essays. Each essay is rated on spelling, grammar, ethos, pathos and logos (5 items). Each essay is rated by 2 raters. So each test-taker has 3x5x2 = 30 ratings.
Elina: Thanks again. This helped a lot in my test design.
gleaner:
Thanks a lot, Dr Linacre.
I feel that I have a very bad understanding of Rasch as well as statistics.
So following your explanation, shall I use Rasch to compute a set of computer-aided speoken language rratings , e.g. one rater
( computer ) X one rating X 300 students= 300 ratings. Is it Ok to use it for analysis, e.g. plotting the ability of the respondents? Or the precision of calculation of person ability will be not so good since there is only one item, though there are enough respondents, let's say 300, and Rasch would work.
Mike.Linacre:
Gleaner, if there is only one rating for each student, then Rasch does not work. The observed single ratings are the best statistic there is.
In this situation, Rasch expects at least "two ratings X 300 students" = 600 ratings.
handedin2 November 27th, 2013, 11:40am:
Dear board,
I have a question, or a series of questions, regarding the application of person weights (PWEIGHTS=) to a dataset based on a number of different languages/language groups. I'm a relative newcomer to Winsteps and Rasch modelling in general so any advice would be much appreciated. First I will explain the situation then I will specify my questions.
The situation is that I am calibrating items, usually using 10 anchor items and 10-20 items to be calibrated. Typically I have datasets of between 110 - 160 participants. These participants usually comprise of 2-3-4 different language groups (i.e. Slavic/ Germanic/ Romance etc.) and the sample sizes are unequal. Sometimes the weights look like 30% / 70%, sometimes it is 5% / 25%/ 70%, etc. I have been asked by those above to weigh my analyses in order to balance the respective influence of each language group. However, I have a number of problems with using weights in this situation. I have a hunch that it is inappropriate and has the potential to seriously distort the data. I would very much appreciate the advice of the board on these issues.
1, Is it the case that as the selection of languages in the sample is not representative of the whole population of languages that the test will be used for weighing is spurious anyway?
2, There is a danger that there may be a conflation of ability/ability on specific types of questions with nationality. As samples for each language group are taken from the same language school, hardly a representative sample of speakers of that particular language group, there is a danger that weights may distort the calibrated values if a) the students in one language school and language group are simply lot higher ability than those from another school/language group, b) impact the calibrated values if one particular language school is specialist school with students with expertise in a particular area, i.e. a technical school or an economics school. Does this line of reasoning make sense?
3, I feel uncomfortable with reducing the contribution of some test takers and increasing the contribution of others for the reason of different first languages. Clearly it is a bad idea to start putting weights on 5% of the data, but I, personally, fell it is rather pointless putting weights on at all in the situation described above. The ability of the individual student is more important the effect of their first language on the final scores for the calibrated items so any move to change the amount of contribution an individual makes to the final values is a distortion for the worse. Again, does this reasoning make sense?
4, If I am entirely wrong and it is fine to put weights on in the situation outlined above, what is the minimum number of participants that you judge should be weighed?
Many thanks in advance for anyone who can shed any light on these questions.
Best,
Handin2
Mike.Linacre:
Thank you for posting, Handin2.
Most of your questions about census-weighting of language groups is outside my expertise. Perhaps a language-testing group or a wider Rasch group can help. The Rasch Listserv can be accessed through https://www.rasch.org/rmt/ and the Language Testing Listserv can be accessed through http://languagetesting.info/ltest-l.html
General advice on Rasch analysis.
1) Please have at least 30 participants in any group to obtain stable estimates of the group.
2) Analyze your data before applying any weighting. This will verify that everything is functioning correctly. It also tells you the correct Reliability for these data. = R
3) Weight the data and reanalyze. This will report a new Reliability = R'
4 Multiply or divide all the weights until the reported Reliability matches the Reliability in (2). If this is not done, the statistical fit tests will be artificially deflated or inflated. The multiplier is: M = (R*(1-R')) / (R'*(1-R))
handedin2:
Dear Mr Linacre,
Thank you so much for your reply.
This is an issue that is, clearly, outside my area of expertise also. I could run some simulation studies to attempt find out the answer to these questions, however, this would be time consuming. I must admit I was fishing for an easy answer. Though, as an early career academic, if I thought there might be a call (and an outlet) for this type of question to be answered I would have a go at answering for the purposes of publication.
Thank you very much for taking the time to address my questions your advice is very much appreciated. I with refer this question to ltestl and the other board you suggested.
Best,
Handin2
Gathercole:
Hi Handin2,
I'm a language proficiency test developer so I hope you won't mind if I give my (semi-solicited) opinion :)
The short answer is that it's better to select calibrated items that are minimally affected by language group, than to try and mess with the weighting of your analysis to control for putative group differences that may or may not be present in a given administration.
You asked about whether differences between the pilot/calibration group and the actual candidate group will distort the calibrations.
If the pilot group is uniformly better or worse at EVERYTHING than the actual group, the calibrations will NOT be distorted. Example: calibrating on a higher level language class then testing a lower level language class. That would be fine, although you should still check the relative item measures to confirm that the groups differ uniformly in ability.
But if the pilot group is better at SOME things than the actual group but worse at some other things, then the calibrations may be distorted. For example, if you are calibrating an English test on Arabic speakers, you will find that speaking is easier than reading. If you then go to test Japanese speakers, your calibrations may not be accurate because Japanese students in general find reading easier than speaking.
Same thing with your example of students with special expertise. If there are reading comprehension passages on your test that deal with different subjects, certain passages may be easier or harder for math vs. humanities students, for example. This would distort the calibrations of items based on those passages.
Ultimately however, all of these off-dimensional effects matter less than overall linguistic ability. If you are trying to establish whether person-weighting is necessary (and I would avoid it if at all possible), I would recommend cross-plotting the item difficulties for one group vs. another:
1. Take a dataset from a single administration that includes two language groups.
2. Anchor a broad cross-section of the items, attempting to include items of all different types that you think might be affected by the first-language differences.
3. Run the analysis once with only the Russians, and get the item difficulties
4. Run the analysis again with only the Germans, and get the item difficulties according to them.
5. Scatter-plot the "Russian" item difficulties against the "German" item difficulties. You will see both how similar the groups are in general, and you will also see particular items which have very different difficulties for Russians vs. Germans. Obviously ignore the anchored items which will be locked to the same difficulty for both groups.
handedin2:
Dear Gareth,
Thank you very much for your response I very much value your input. I think your phrase to "try and mess with the weighting of your analysis" sums up my feeling towards putting weights on the language groups in this situation.
Ironically, it is me who has to provide the argument for the simpler model, without weights on the person parameters. I feel it should really be the other way around, i.e. show that weights improve the calibration before including them.
best,
Handin2.
aureliel November 28th, 2013, 10:59am:
Dear all,
In my spss file missing data was coded as 9. In the control file for winsteps I deleted the code '9' from CODES= to tell Winsteps those weren't valid codes in my rating scale.
This all seemed to go ok, however, when I inspected the xfile, I saw that all these 9-values had a value of -1 in the column for the original and observed value. How come? Does this mean something went wrong?
I hope my question is making any sense.
Kind regards,
Aurelie
Mike.Linacre:
Aurelie: all is well.
-1 means "missing data" to Winsteps.
uve November 21st, 2013, 6:20pm:
Mike,
In most situations that I've encountered so far, when there are disordered thresholds, collapsing categories seems to do more harm than good. For instance, RMSE usually increases, person separation decreases, variance explained by measures decreases, and item underfit can often increase as well.
If there were advantages to offset these problems I would love to know, but the cost of doing so seems too high. In my experience I have never encountered a situation yet where there is any advantage in collapsing categories; however, my inexperience in this area may be hindering me from fully appreciating and seeing the advantages.
I just wish I knew better what those would be.
Mike.Linacre:
Uve, collapsing categories loses statistical information, so the advantage is solely in inference. If we are in a situation where we need to be able to predict that progress up the latent variable for each object of measurement (e.g., patient) will be observed as strict progress up the rating scale with no jumps over intermediate categories, then we need ordered thresholds.
In medical and physical-science rating-scales, disordered thresholds often indicate transitional categories. For instance, 1=ice, 2=super-cooled water, 3=regular water. We only observe (2) in the transition from 3 -> 2 -> 1, never 1 -> 3. Consequently, for particular applications, we may collapse 1+2 or 2+3, depending on whether we are interested in temperature or fluidity, or we may maintain all 3 categories, knowing that prediction of category 2 will be idiosyncratic.
Strictly-ordered prediction is not always desirable. For instance, on surveys, there may be a middle "neutral/don't know/don't care/don't want to tell you" category that we really do not want to observe or predict. We hope that this category will be rarely observed, resulting in strongly disordered thresholds. Consequently, if there are strongly disordered thresholds, we will never predict that we will observe that category for any specific individual, and only rarely for a sample from a population.
uve:
It seems that a disordered threshold does not substantially affect an item's average difficulty. If this is true then the item hierarchy remains largely the same. I realize that ordered categories are supposed to describe more of the trait as it relates to the single item of interest, but item hierarchy seems to be what we are ultimately after. If I know that respondents are less likely to endorse item X than item Y, then it seems I have most of what I need.
If I attempt to force threshold order by collapsing categories, then I can see how the reduction of information makes sense because the item is not doing what it ideally should be doing and we now see that in this reduction. If the categories are disordered, their interpretive meaning by the respondents is called into question. But couldn't I come to similar conclusions investigating fit?
Mike.Linacre:
This gets complicated, Uve.
Collapsing categories for the Rating Scale model doe snot change the item difficulty hierarchy. For the Partial Credit model, it does change the hierarchy, but the PCM hierarchy is already much more difficult to interpret because it interacts with the definitions of the categories for each item. Accordingly, for PCM, "pivot anchoring" is recommended if strong inferences are to be drawn from the hierarchy: https://www.rasch.org/rmt/rmt113e.htm
Standard fit statistics do not report disordering, because disordering is not a violation of the mathematics of a polytomous Rasch model. Disordering can be detrimental to inferences based on a polytomous Rasch model.
The "RMSR" statistic indicates the degree to which the data can predict itself under the Rasch model, The reduction when categories are collapsed (for whatever reason) indicates the improvement in predicting exact categories. Obviously, it is easier to predict fewer categories, so if we collapsed a polytomy to a dichotomy, then RMSR must necessarily reduce. This reminds us of the trade-off: improved prediction of categories vs. loss of measurement precision. We see the same thing if we have a ruler marked in millimeters and another marked only in centimeters. It is easier to predict a measurement in centimeters, but it is more precise to measure in millimeters.
uve:
Thanks for the reminder of Dr. Bode's work. I've used the pivot anchoring process several times and find it very helpful.
In regards to collapsing categories, I was wondering if the opposite process has validity. That is, what if we could add more categories? Then based on your previous responses, we might get more information, but predictability could decrease as well.
Therefore, to me, whether we collapse or not, add or not, would our ultimate goal be more to interpret the item order along the construct as opposed to analyzing category disordering?
Mike.Linacre:
Uve, the motivation behind the Partial Credit model was to obtain more information from dichotomous MCQ items. Essentially, to split the "wrong" answer into multiple levels of "wrongness". Predictability definitely decreases, and threshold disordering is usual, but no one is interested in predicting the degree of wrongness (wrong categories). Prediction is limited to the top category: rightness.
Yes, unless we can interpret the item order, we do not know what we are measuring. Threshold disordering and item fit are much less important.
zaq0718 November 25th, 2013, 2:48am:
I am trying to run Mixture Rasch model by Mplus and I want to try if I could find any anchor items in a test. If I could find an anchor item , so that I can make the result comparable. I know there is another way to make results comparable, which is to set both groups are N~(0,1).
Now, I want to make item discrimnities are equal 1 across both groups, and item difficulties are different within groups , but the same between groups. And, I assumed the first group' s mean is 0 , but variance is freely estimated . The second group's mean and variance are both freely estimated. In such setting , I will let first item freely estimated, and the remaining items are constraint ,then iterate this procedure til I find which item could be an anchor item.
Does anyone know which program could do that or how to write codes in mplus?
Thanks!
Mike.Linacre: Thank you for your question, zaq0718. Please post it at http://www.statmodel.com/cgi-bin/discus/discus.cgi which is the Mplus Discussion area. Bengt Muthen probably has the best answer :-)
acdwyer77 November 19th, 2013, 7:40pm:
I just analyzed an exam with a combination of multiple choice questions (dichotomously scored, Rasch model) and simulation questions (polytomously scored, PC model). I am wondering if anyone has any good resources that explain the output tables that are produced by Winsteps. For example, I'm wondering exactly how to interpret the "item measure" estimate for a polytomously scored item.
Also, I'm interested interpreting all the output in Table 3.2. For example, what are the "structure calibration" values?
The information on the Winsteps help site (https://www.winsteps.com/winman/index.htm) is indeed helpful, but if someone knows of additional resources that have clearer examples, I would appreciate it. Thanks!
Mike.Linacre:
Acdwyer, it sounds like you are new to polytomous Rasch analysis. The book, "Rating Scale Analysis" is the basic resource, www.rasch.org/rsa.htm
Please also look at the Winsteps Tutorials: www.winsteps.com/tutorials.htm - Winsteps Tutorial 2 may be exactly what you want :-)
acdwyer77: Again, thanks so much! I hadn't been aware of the tutorials.
acdwyer77 November 19th, 2013, 7:59pm:
I'm also looking for a resource that explains how person scores (i.e., measures) are computed in Winsteps. Suppose, for example, I have a test with 10 multiple choice items (dichotomously scored, Rasch model). I know parameter estimation is an iterative process, but once I have obtained (final) calibrated item measures for all 10 items, if I know an examinee's total score on those 10 items, I would think I would have all the information I would need to compute that examinee's ability estimate (i.e., person measure).
Does anyone have this formula or a reference that explains how this works? Thanks!
Mike.Linacre: Certainly, acdwyer, if you know the item estimates (and threshold estimates for polytomous items), then estimation is done by www.rasch.org/rmt/rmt122q.htm
acdwyer77: Awesome, thanks!
ybae3 November 15th, 2013, 10:20am:
Dear Dr. Linacre,
I am examining a tool for measuring preschool teachers' awareness of teacher-parent communication.
The followings are the results from Rasch dimensionality analysis:
1) Variance explained by measures is 59.5%;
Unexplained variance in 1st contrast is 3.6 below the Table 23.0.
2) In PCA plot,items DEe are separate from the other items.
My decision is that the tool has unidimensional even though Unexplained variance in 1st contrast is 3.6 and the items DEe are separate from the other items. The reason is that these 3 items still work for measuring the teachers' awareness with three sub-domains. Is it okay to do this?
Thank you for your guidance!
Youlmi
TABLE 23.0 C:\USERS\DONGJO\DESKTOP\CHOBAE\1109_RE ZOU456WS.TXT Nov 9 22:40 2013
INPUT: 80 PERSONS 10 ITEMS MEASURED: 80 PERSONS 10 ITEMS 4 CATS 3.62.1
--------------------------------------------------------------------------------
STANDARDIZED RESIDUAL VARIANCE SCREE PLOT
Table of STANDARDIZED RESIDUAL variance (in Eigenvalue units)
Empirical Modeled
Total variance in observations = 24.7 100.0% 100.0%
Variance explained by measures = 14.7 59.5% 58.1%
Unexplained variance (total) = 10.0 40.5% 100.0% 41.9%
Unexplned variance in 1st contrast = 3.6 14.6% 36.0%
Unexplned variance in 2nd contrast = 1.5 6.1% 15.2%
Unexplned variance in 3rd contrast = 1.3 5.5% 13.5%
Unexplned variance in 4th contrast = 1.0 4.0% 9.9%
Unexplned variance in 5th contrast = .7 2.8% 6.9%
VARIANCE COMPONENT SCREE PLOT
+--+--+--+--+--+--+--+--+--+
100%+ T +
| |
V 63%+ +
A | M |
R 40%+ U +
I | |
A 25%+ +
N | |
C 16%+ +
E | 1 |
10%+ +
L | |
O 6%+ +
G | 2 3 |
| 4%+ 4 +
S | |
C 3%+ 5 +
A | |
L 2%+ +
E | |
D 1%+ +
| |
0.5%+ +
+--+--+--+--+--+--+--+--+--+
TV MV UV U1 U2 U3 U4 U5
VARIANCE COMPONENTS
TABLE 23.2 C:\USERS\DONGJO\DESKTOP\CHOBAE\1109_RE ZOU456WS.TXT Nov 9 22:40 2013
INPUT: 80 PERSONS 10 ITEMS MEASURED: 80 PERSONS 10 ITEMS 4 CATS 3.62.1
--------------------------------------------------------------------------------
STANDARDIZED RESIDUAL CONTRAST 1 PLOT
Table of STANDARDIZED RESIDUAL variance (in Eigenvalue units)
Empirical Modeled
Total variance in observations = 24.7 100.0% 100.0%
Variance explained by measures = 14.7 59.5% 58.1%
Unexplained variance (total) = 10.0 40.5% 100.0% 41.9%
Unexplned variance in 1st contrast = 3.6 14.6% 36.0%
-3 -2 -1 0 1 2
++------------+------------+------------+------------+------------++ COUNT
.8 + | +
| | A | 1
.7 + B | + 1
| C | | 1
.6 + D | + 1
| | |
.5 + | +
C | | |
O .4 + | +
N | | |
T .3 + | +
R | E | | 1
A .2 + | +
S | | |
T .1 + | +
| | |
1 .0 +---------------------------------------|--------------------------+
| |e | 1
L -.1 + | +
O | | |
A -.2 + | +
D | | |
I -.3 + | +
N | | |
G -.4 + | +
| | |
-.5 + | +
| d | | 1
-.6 + | c + 1
| | |
-.7 + | b + 1
| | a | 1
++------------+------------+------------+------------+------------++
-3 -2 -1 0 1 2
ITEM MEASURE
COUNT: 1 1 111 11 1 1 1
Mike.Linacre:
Thank you for your question, Youlmi.
You are using Winsteps 3.62.1 (2006). The current version of Winsteps 3.80.1 (2013) gives more guidance, but, based on what we see here, there is a very strong split between the items labeled ABCDE and the items labeled abcd with item e in the middle. The split has a strength (eigenvalue) of 3.6 (items). There is very strong evidence that this test is multidimensional.
Suggestion: perform two separate analyses: items ABCDE and items abcd. Cross-plot the person measures for the two analyses. What is the pattern? If it is a cloudy (bottom left to top right) diagonal, then the test is unidimensional. If the pattern is a random cluster (or worse) then the test is multidimensional.
ybae3:
The following is the results from two separate analyses.
1) Analysis with items abcd
TABLE 23.2 C:\USERS\DONGJO\DESKTOP\CHOBAE\1.SAV ZOU712WS.TXT Nov 15 19:45 2013
INPUT: 80 PERSONS 4 ITEMS MEASURED: 80 PERSONS 4 ITEMS 4 CATS WINSTEPS 3.62.1
--------------------------------------------------------------------------------
STANDARDIZED RESIDUAL CONTRAST 1 PLOT
Table of STANDARDIZED RESIDUAL variance (in Eigenvalue units)
Empirical Modeled
Total variance in observations = 14.9 100.0% 100.0%
Variance explained by measures = 10.9 73.2% 72.9%
Unexplained variance (total) = 4.0 26.8% 100.0% 27.1%
Unexplned variance in 1st contrast = 2.1 13.9% 51.6%
-3 -2 -1 0 1 2
++------------+------------+------------+------------+------------++ COUNT
.8 + | +
| | 2 | 1
.7 + | 1 + 1
| | |
.6 + | +
| | |
.5 + | +
C | | |
O .4 + | +
N | | |
T .3 + | +
R | | |
A .2 + | +
S | | |
T .1 + | +
| | |
1 .0 +---------------------------------------|--------------------------+
| | |
L -.1 + | +
O | | |
A -.2 + | +
D | | |
I -.3 + | +
N | | |
G -.4 + | +
| | |
-.5 + | +
| | |
-.6 + | +
| | |
-.7 + 4 |3 + 2
| | |
++------------+------------+------------+------------+------------++
-3 -2 -1 0 1 2
ITEM MEASURE
COUNT: 1 1 1 1
2) Analysis with items ABCDE
TABLE 23.2 C:\USERS\DONGJO\DESKTOP\CHOBAE\2.SAV ZOU288WS.TXT Nov 15 19:50 2013
INPUT: 80 PERSONS 5 ITEMS MEASURED: 80 PERSONS 5 ITEMS 4 CATS WINSTEPS 3.62.1
--------------------------------------------------------------------------------
STANDARDIZED RESIDUAL CONTRAST 1 PLOT
Table of STANDARDIZED RESIDUAL variance (in Eigenvalue units)
Empirical Modeled
Total variance in observations = 17.8 100.0% 100.0%
Variance explained by measures = 12.8 71.9% 73.0%
Unexplained variance (total) = 5.0 28.1% 100.0% 27.0%
Unexplned variance in 1st contrast = 1.9 10.5% 37.5%
-3 -2 -1 0 1 2
++------------+------------+------------+------------+------------++ COUNT
.8 + 2 | + 1
| 1 | | 1
.7 + | +
| | |
.6 + | +
| | |
C .5 + | +
O | | |
N .4 + | +
T | | |
R .3 + | +
A | | |
S .2 + | +
T | | |
.1 + | +
1 | | |
.0 +---------------------------------------|--------------------------+
L | | |
O -.1 + | +
A | | |
D -.2 + | +
I | | |
N -.3 + | 5 + 1
G | | 3 | 1
-.4 + | +
| | |
-.5 + | +
| | |
-.6 + | +
| | |
-.7 + | 4 + 1
++------------+------------+------------+------------+------------++
-3 -2 -1 0 1 2
ITEM MEASURE
COUNT: 1 1 1 1 1
Above tables are the patterns from the analyses. Did I follow your advice for the analyses?
Mike.Linacre: Youlmi, we need the person measures from the two analyses, plotted against each other. This will tell us what is the relationship between the predictive validity of the two subsets of items. Do they predict the same outcomes or different outcomes?
ybae3:
Thank you for your advice!
This is my first time to do two analyses with one measure. I am going to use Table 17(PERSON:measure) in the output tables-This is Winsteps 3.62.1(2006) and I haven't bought a new version yet :B . If I am still going to a wrong direction, could you give me information how to obtain the person measures from the two analyses, plotted against each other?
Your Question: Do they predict the same outcomes or different outcomes"
My Answer: They predict different outcomes.
For example, when teachers have more difficulties in teacher-parent communication, they have less self-efficacy in teacher-parent communication.
Thank you again!
Youlmi
Mike.Linacre:
Youlmi,
1) In the analysis of all the items together, please verify that all items have positive correlations: Winsteps Diagnosis Menu A.
If they do not, then use NEWSCORE= and RESCORE= to reverse-score items with negative correlations.
Then ....
2) from the analysis of the first set of items: Output Files menu: output PFILE=pf.txt
3) from the analysis of the second set of items: Plots menu: Scatterplot:
Plot the person measures of the current analysis against the person measures in the pf.txt file.
ybae3:
Dear Dr. Linacre,
I really appreciate you for the guidance.
Your advice: 1) In the analysis of all the items together, please verify that all items have positive correlations: Winsteps Diagnosis Menu A.
By following your advice, I got Table 26.1. I think that all items have positive correlations.
TABLE 26.1 C:\USERS\DONGJO\DESKTOP\CHOBAE\3.SAV ZOU384WS.TXT Nov 17 14:19 2013
INPUT: 80 PERSONS 9 ITEMS MEASURED: 80 PERSONS 9 ITEMS 4 CATS WINSTEPS 3.62.1
--------------------------------------------------------------------------------
PERSON: REAL SEP.: 1.12 REL.: .56 ... ITEM: REAL SEP.: 6.11 REL.: .97
ITEM STATISTICS: CORRELATION ORDER
+-----------------------------------------------------------------------------------+
|ENTRY RAW MODEL| INFIT | OUTFIT |PTMEA|EXACT MATCH| |
|NUMBER SCORE COUNT MEASURE S.E. |MNSQ ZSTD|MNSQ ZSTD|CORR.| OBS% EXP%| ITEM |
|------------------------------------+----------+----------+-----+-----------+------|
| 1 207 80 1.52 .18|1.08 .6|1.08 .6| .31| 53.8 57.3| Q2 |
| 2 198 80 1.82 .18|1.08 .5|1.07 .5| .33| 52.5 57.8| Q3 |
| 5 302 80 -2.37 .27| .94 -.3| .83 -.5| .42| 80.0 78.9| Q6 |
| 9 259 80 -.28 .19| .89 -.7| .88 -.7| .49| 65.0 60.8| Q10 |
| 6 289 80 -1.57 .23| .89 -.7| .85 -.7| .49| 75.0 68.0| Q7 |
| 4 258 80 -.24 .19| .79 -1.5| .79 -1.4| .50| 63.8 60.8| Q5 |
| 8 246 80 .20 .19|1.00 .1| .99 .0| .54| 57.5 59.7| Q9 |
| 3 221 80 1.06 .18|1.14 .9|1.13 .9| .58| 55.0 57.3| Q4 |
| 7 255 80 -.13 .19|1.18 1.2|1.13 .9| .63| 58.8 60.7| Q8 |
|------------------------------------+----------+----------+-----+-----------+------|
| MEAN 248.3 80.0 .00 .20|1.00 .0| .97 -.1| | 62.4 62.3| |
| S.D. 33.0 .0 1.29 .03| .13 .8| .13 .8| | 9.1 6.6| |
+-----------------------------------------------------------------------------------+
However, I still have a difficulty in following your 2) & 3) advice :'( There are no exact options like 'output PFILE=pf.txt', 'Scatterplot'. Is this resulting from using the old version? I am very sorry for bothering you!
Mike.Linacre:
Youlmi, yes, all your correlations are positive. Good!
In your version,
Winsteps menu bar (top of window), Output Files, 3rd entry: PFILE=
Winsteps menu bar (top of window), Plots, Compare Statistics
Please look at Winsteps Help menu to see how to use these options.
ybae3:
Thank you very much, Dr. Linacre!
I am looking at Winsteps Help menu now. I will post the results for your advice 2) & 3) sooner or later :)
ybae3:
Hi Dr. Linacre,
I attached the results. Did I follow your advice correctly?
Thank you!!
Mike.Linacre:
Yes, youlmi, that looks good.
Now, go to the Worksheet in your .xlsx file.
Correlate the two sets of measures in columns B and D
The correlation is negative: -0.13
The two sets of items are definitely measuring different latent variables.
Since Winsteps assumes a positive correlation, please use Excel to plot a linear trend-line through the points. You will see that it has a negative slope.
ybae3:
Dear Dr. Linacre,
Thank you! I saw that it has a negative slope.
Then, it means that the two sets of items are not able to measure teachers' awareness of teacher-parent communication. Is this correct?
Mike.Linacre: Youlmi, we know the two sets of items measure different latent variables. Please look at the content of the items in order to define the two latent variables.
ybae3: The two latent variables are 'difficulty' and 'self-efficacy'. These two variables are defined as awareness that teachers feel and think about teacher-parent communication. Therefore, the two sets of items can measure the teachers' awareness-this is my thought. is it reasonable?
Mike.Linacre:
Youlmi, please be more precise in your definitions of the latent variables:
"difficulty" to do what?
"self-efficacy" in doing what?
ybae3:
Dear Dr. Linacre,
'difficulty' : Teachers feel/experience any difficulties when they communicate with parents of children. Difficulties may result from parents' lack of understanding about early childhood education and inappropriate expectations about their children, and lack of trust between teachers and parents.
'self-efficacy': Teachers think that communicating with parents may help their understanding about growth and development of children and ability of teaching and making-decision. Also, communicating with parents may improve effectiveness of education by connecting family and preschool and encourage parents to involve their children's education.
Mike.Linacre:
That is interesting, Youlmi. Here is my interpretation:
Difficulty is the impact of others on the teacher
Self-efficacy is the impact of the teachers on others
ybae3:
Dear Dr. Linacre,
Your interpretation is correct :)
Thank you very much for your guidance!
Sincerely,
Youlmi
Newbie_2013 November 3rd, 2013, 2:00am:
Dear Mike,
If you have the time, I have two questions about the lower asymptote and upper asymptote.
1. In Winsteps, are the asymptote values in probability units or logits? Based on the equation for the 4-PL, I would assume they are in probability units but I'm not sure if that is correct. (I realize these are not being estimated in Winsteps since Winsteps only fits Rasch models)
2. What are the cutoffs that would suggest that one might consider including a lower and/or upper asymptote? (e.g., .20 or greater for lower)? I read that the estimates for the lower asymptote should be near the reciprocal of the total number of response options. Is that correct?
Thank you!
Mike.Linacre:
Newbie_2013,
1) raw-score units, which for dichotomies is the same as probability units.
2) if low performers are guessing on high-difficulty dichotomous items, then we expect that they will choose the correct option by chance. Then
lower asymptote = 1 / (number of options)
However, rather than modeling the lower asymptote, it makes more sense to trim out observations in the guessing region by using CUTLO=-1. This parallels what would be done on a computer-adaptive test. www.winsteps.com/winman/cutlo.htm
Newbie_2013:
Mike,
Thank you for the informative responses.
Are there 3 and/or 4-Parameter models for polytomous items? Might you know of any examples?
Thanks so much!
Newbie
Mike.Linacre: Newbie, not that I know of, but you could construct your own. Then publish a Paper about it. Then be famous!
Newbie_2013:
LOL. Perhaps one day, yes. I will need your help, though!
Another question, if you don't mind.
The Rating Scale Model ( Andrich, 1978 ) assumes the kth threshold is common to all items. Is there an extension of the Rating Scale Model (same thresholds for all items) which allows for varying discriminations?
I am familiar with the generalized partial credit model and the graded response model, but I do not believe that either is a direct extension of the Rating Scale Model.
Thanks again!
Mike.Linacre: Newbie, a model which estimates both thresholds and discriminations simultaneously would not be Rasch models. Rasch models can have preset thresholds and estimated discrimination (such as the Poisson model) or estimated thresholds and preset discrimination (such as the Partial Credit model).
Newbie_2013:
Dear Mike,
I am sorry for not being clear.
I was wondering if there was an IRT model that is an extension of the Rating Scale Model, similar to how the 2PL model is an extension of Rasch/1PL.
Thanks,
Newbie
Mike.Linacre: Newbie, since IRT is generally concerned about describing each item's functioning, it is the Generalized Partial Credit Model that is the 2PL version of the Rasch RSM and PCM models.
Gathercole:
Hi Mike,
Could you clarify the term Wni in the equation that Winsteps uses to estimate the lower asymptote, i.e. ci= SUM (Wni mi (Xni - Eni)) / SUM (Wni (mi - Eni))? Thanks and sorry for the confusion.
Mike.Linacre:
Gathercole, here is a revised version on https://www.winsteps.com/winman/index.htm?asymptote.htm
A lower-asymptote model for dichotomies or polytomies is:
Tni = ci + (mi - ci) (Eni/mi)
where Tni is the expected observation for person n on item i, ci is the lower asymptote for item i, mi is the highest category for item i (counting up from 0), and Eni is the Rasch expected value (without asymptotes). Rewriting:
ci = mi (Tni - Eni) / (mi - Eni)
This provides the basis for a model for estimating ci. Since we are concerned about the lower asymptote, let us define
Bi = B(Eni=0.5) as the ability of a person who scores 0.5 on the item,
then Bni = Bn - Di and Wni = Bni - Bi for all Bn < Bi otherwise Wni = 0, for each observation Xni with expectation Eni,
[Wni acts as a weight so that the lower the ability, the greater the influence on the estimate of ci]
ci Ōēł ╬Ż(Wni mi (Xni - Eni)) / ╬Ż(Wni (mi - Eni))
Similarly, for di, the upper asymptote,
di Ōēł ╬Ż(Wni mi Xni) / ╬Ż(Wni Eni)) for Bni>B(Eni=mi-0.5)
The lower asymptote is the lower of ci or the item p-value. The upper asymptote is the higher of di or the item p-value.
Gathercole:
Hi Mike,
Ah, I see. I was confused as to how B(Eni=0.5) was different from Di. I was wondering why the equation wasn't written Bn-2*Di. Thanks for the quick clarification!
Mike.Linacre: Gathercole, Bi=Di for dichotomies, but Winsteps generalizes to polytomies.
Gathercole:
Hi Mike,
Thanks for taking the time to explain what's going on in more detail. I am trying to wrap my head around what seems like a counterintuitive relationship between the lower asymptote estimate and other statistics. Here is an example of four 3-choice MCQ items from a recent assessment. There were >600 responses per item.
Pvalue Outfit MNSQ Lower Asymptote Estimate
Item 1 .10 2.24 .04
Item 2 .21 1.56 .08
Item 3 .53 1.13 .19
Item 4 .83 0.93 .26
Looking only at the Pvalue and Outfit, and knowing these are 3-choice MCQs, the story seems clear: The fit of Items 1 and 2, the difficult items, is being negatively impacted by guessing. The easier items, 3 and 4, are measuring better because lucky guessing is less of a factor for them.
But I'm confused by the seemingly contradictory lower asymptote estimates, which seem to be estimating asymptotes closer to zero for the hard items and much higher asymptotes for the easier items. In fact, in the full dataset I found a .52 correlation between asymptote height and Pvalue among items with nonzero asymptote estimates. Am I missing something here about this relationship?
Mike.Linacre:
Gathercole, you have rediscovered something that all 3-PL analysts also discover. Estimating the lower asymptote (and the upper asymptote) is very difficult. Consequently, in 3-PL analysis, the lower asymptote is usually set at 1/(number of options).
Of course, when estimated from empirical data, the lower asymptote cannot be higher than the p-value (otherwise it would not be a lower asymptote!).
Gathercole:
Ok, thank you. It's good to know I (or my data) wasn't hallucinating. I had noticed that 3PL software c-parameters often came out to approximately 1/(k+1) +/- .03, but thought the calculation was more empirical and less dominated by prior assumptions.
I suppose one irony of trying to estimate the asymptote from the data is that the lower asymptote is an attempt to quantify the rule "Eni cannot be less than 1/k for any people." But ironically, an easier item could fit the rule more than a harder item because it will have fewer Eni's below 1/k.
Mike.Linacre: Gathercole, yes, there are several paradoxes in 3-PL estimation. For instance, most people think that someone who gets the easy items wrong, but the hard items right should have a higher estimate than the reverse situation, but for 3-PL the opposite is true. 3-PL thinks "easy items wrong, but the hard items right" is due to guessing, and so penalizes the examinee.
gleaner November 19th, 2013, 2:02am:
In documentation of Winsteps, Table 30 produced information about person DIF. I feel that the DIF statistics in the table reported is nonuniform DIF, i.e. an interaction
between group membership and the latent construct being measured (Narayanan & Swaminathan, 1994). Am I right on this?
Secondly,Various statistical methods have been developed for detecting DIF (Camilli, 2006; Penfield & Camilli, 2007). These include methods based on item response
theory (IRT) , regression analysis, and nonparametric approaches based on observed item scores or the odds ratio. What statistical method does DIF statistics adopt in Winsteps? Nonparametric?
Dr Linacre, Thanks a lot!
Mike.Linacre:
Thank you for your questions, Gleaner.
1) In Winsteps Table 30, uniform DIF is usually reported. If you want non-uniform DIF then please add +MA3 (or similar) to the DIF variable identification.
2) Winsteps implements to DIF detection methods:
a) Mantel-Haenszel (for dichotomies) and Mantel (for polytomies). These are log-odds estimators based on sample stratification with chi-square significance tests.
b) Rasch-estimation-based method in which item difficulties are estimated for each DIF classification group with t-test comparisons of the estimates
Since (a) is generally recognized as authoritative by most reviewers, and (b) is easy for me to confirm and explain, other DIF detection methods have not been implemented in Winsteps.
Newbie_2013 November 17th, 2013, 10:27pm:
Dear Mike,
I have the following design:
1. 5 Participants (Target)
2. 3 Observers (Facet)
3. 3 Items (Facet)
4. Ratings (1 to 10 scale)
Each participant was rated by each observer on each item. So I have 5X3X3=45 ratings
Two questions:
1. How should I construct the dataset to feed in to Winsteps?
2. How would I fit the model using Winsteps?
I have been reading the documentation and I'm still confused...Any help would be greatly appreciated!
Thanks!
Newbie
Mike.Linacre:
Newbie, your design is similar to the Ice-Skating example in Winsteps Example15.txt
First: what is the "object of measurement"? In the Ice-Skating example we want to investigate the behavior of the judges (=Observers). But perhaps here we want to measure the Participants. So let's do that ...
Second: 5 Participants are 5 rows, Observers x Items are the 9 columns (Winsteps items).
We can do a standard Winsteps analysis and measure the 5 Participants.
Third: In the labels for each column, put the Observer number and the Item number.
We can now also do reports by Observer and reports by Item. For instance, Winsteps Table 27 and Winsteps Table 31.
Fourth: We can rearrange the data and repeat the process. For instance:
3 Items = 3 columns
5 Participants x 3 Observers = 15 rows
also
3 Observers = 3 columns
5 Participants x 3 Items = 15 rows
Newbie_2013:
Dear Mike,
I have attached the WINSTEPS file. I don't think it is correct, but I think (hope!) it's close. Would you mind taking a look and letting me know what you think?
Please note that OBS1_I1 = observer 1, item 1 and so on.
Thank you!
Newbie
gleaner: Sorry to interrupt. Newbie said that ten point scale was applied but in the cntrol file there read codes =123456789 nine point scale???
Mike.Linacre:
Newbie, that analysis looks like it would work.
Gleaner, it appears that only 1-9 have been observed. If 0 or 10 are possible observations, then we have to take special action to force them into the rating scale,
Newbie_2013:
Thank you, Mike!
Since I have a fully crossed-design, according to the textbook I am reading, one would calculate the relative generalizability coefficient on the raw scores as follows:
participant variance component = p_vc
participant-X-item variance component = p_i_vc
participant-X-observer variance component = p_o_vc
residual variance component = r_vc
ni = number of items
no = number of observers
relative generalizability coefficient equation =
p_vc / [p_vc + (p_i_vc / ni) + (p_o_vc / no) + (r_vc / ni*no)]
Question.
The book recommends one calculate this coefficient on the raw scores by first calculating the mean-squares and then the variance components via general linear model.
How would we calculate the relative generalizability coefficient from the Winsteps output?
Thanks again for all your help!
Newbie
gleaner:
So do you mean that if observation data has only 1-9, so codes may be written as 1,2,3,4,5,6,7.8,9 though ten point scale was conceived first in the rating scale or questionnaire?
Thanks a lot, sorry to interrupt Newbie's thread for asking this.
You said "If 0 or 10 are possible observations, then we have to take special action to force them into the rating scale"
What is to be done to force 0,10 into observations?
Could you please dwell upon this? Thanks a lot!
Mike.Linacre:
Gleaner, Winsteps examines the data to discover which of the codes listed in CODES= actually exist. CODES= screens out invalid observations that may exist in the data file.
For example,
CODES=asdfsadfjklasdfhlasdfnh123456789
means the same as
CODES=123456789
when there are only numeric codes in the data file.
If you want to force unobserved intermediate numeric codes into an analysis, use
STKEEP=Yes
this is the Winsteps default
If you want to force unobserved extreme numeric codes into an analysis, then
either: include dummy data records in your analysis which include the extreme codes,
see https://www.winsteps.com/winman/index.htm?unobservedcategories.htm
or: specify ISRANGE=, see www.winsteps.com/winman/isrange.htm which requires SFUNCTION= to be meaningful: www.winsteps.com/winman/sfunction.htm
gleaner: I see what you mean by that. Thanks a lot!
Newbie_2013:
Hi Mike,
You must be very busy, but just to be sure that it doesn't get lost in the other messages, I have a fundamental question I was hoping to ask. I apologize if you already saw this question. Here you go:
Thank you, Mike!
Since I have a fully crossed-design, according to the textbook I am reading, one would calculate the relative generalizability coefficient on the raw scores as follows:
participant variance component = p_vc
participant-X-item variance component = p_i_vc
participant-X-observer variance component = p_o_vc
residual variance component = r_vc
ni = number of items
no = number of observers
relative generalizability coefficient equation =
p_vc / [p_vc + (p_i_vc / ni) + (p_o_vc / no) + (r_vc / ni*no)]
Question.
The book recommends one calculate this coefficient on the raw scores by first calculating the mean-squares and then the variance components via general linear model.
How would we calculate the relative generalizability coefficient from the Winsteps output?
Thanks again for all your help!
Newbie
Mike.Linacre: Newbie, this appears to be Generalizability Theory. We can approximate it with Winsteps, but it may be easier to model the variance terms directly with the freeware GENOVA - http://www.uiowa.edu/~casma/computer_programs.htm
Newbie_2013:
Thank you, Mike. Would we use the person Rasch measures when calculating the variance components?
Mike.Linacre:
For Generalizability Theory, use the raw observations.
If you want to approximate this with Winsteps, then it would be the equivalent procedure to approximating using Facets: https://www.winsteps.com/facetman/index.htm?table5.htm
but this is not easy :-(
Newbie_2013 November 16th, 2013, 10:33pm:
Hi Mike,
How does one interpret beta (item difficulties) and thetas (person abilities) coefficients from a 1-parameter probit model?
Thanks!
Newbie
Mike.Linacre: Newbie, betas and thetas are interpreted much the same way in a 1-PL probit (normal ogive) model as difficulties and abilities in a dichotomous Rasch model. Fred Lord approximated the 1-PL probit model by the 1-PL logit model with a 1.7 multiplier. See https://www.rasch.org/rmt/rmt193h.htm
Newbie_2013:
Thank you for showing me the chart. If one does not apply the 1.7 conversion, are the parameter estimates from the one parameter probit model interpreted as z-scores? If you move one unit up the scale, how would that be interpreted?
Thanks,
Newbie
Mike.Linacre: Newbie, in the probit model the person-ability distribution is assumed to be unit-normal. If this model fits the data, then the person sample is distributed as a z-statistic.
Newbie_2013 November 13th, 2013, 3:27pm:
Dear Mike,
I recently stumbled upon a website that discussed a 5PL model:
http://www.rd.dnc.ac.jp/~shojima/exmk/irt.htm
I had never heard of the 5PL model. Have you come across it in your work? I know the 3PL is incorporates a "guess-ability" parameter (lower asymptote) and the 4PL incorporates a "mistake-ability" parameter (upper asymptote), but what is the purpose of the 5PL model (asymmetry parameter)? Under what conditions might one consider employing such a model?
Also, are there IRT models that go even higher than 5 parameters?
Thanks!
Newbie
Mike.Linacre: Newpie, a 5-PL is new to me. It is almost impossible to estimate a 4-PL model, so a 5-PL model must be even worse. Conceptually there is no limit to the number of parameters that could be incorporated into an IRT model because it is used to describe a dataset. However, more parameters does not necessarily mean more useful. See the example at https://www.rasch.org/rmt/rmt222b.htm
Newbie_2013: Thank you! Very compelling!
linda October 28th, 2013, 5:06pm:
Hello,
So I've been wanting to verify whether the data I have fit the Rasch model or not. I had a questionnaire made up of 40 questions that was filled out by 10 different persons.
I got the following results (attached). I'm not sure if I'm looking at the right thing or not. But after reading some literature (since am completely a newvbie here) I understood that infit is more dangerous that outfit, and higher values are even more so.
Looking at the questions' fit statistics, there's a lot of questions (more than half ) having high overfit for both outfit and infit, and around 7 questions underfitting again for both outfit and infit. For the persons, only the second person seem to be slightly underfitting for the outfit, but again many persons overfitting for the outfit.
Is that bad or good? Would the rasch model produce reasonable results?
linda: and the person fit statistics
Mike.Linacre:
Thank you for your question, Linda.
In these results, the first place to look is at the large Outfit Mean-Square (Outfit MSQ) statistics, especially those greater than 2.0. See items I2 and I21. These very large outfit mean-squares indicate that there are very unexpected observations, such as lucky guesses or careless mistakes on a multiple-choice test. These very large mean-squares are skewing all the other mean-squares because the estimation process forces the average mean-square to be near 1.0.
In order to make the remainder of the analysis meaningful, when you identify the errant observations, first verify that they are not data entry errors. If they are genuine, and the items are scored correctly, then change those errant observations into missing data. Reanalyze the amended dataset. Now the fit statistics will not be skewed by those aberrations.
For your final report, you must decide whether to include or exclude those observations, depending on the purpose of your questionnaire.
Suggestion: when showing results like this, please also show the Rasch measures (estimates, locations, abilities, difficulties). They give a context to the fit statistics, enabling a more exact diagnosis of any problems.
linda:
Thanks a lot Mike for your feedback, it's much appreciated and helps me a lot.
So I looked over these 2 questions, their responses seem fine for the naked eye.
I attached the questions' computed difficulty parameters. 7 Questions are removed during analysis, due to having no or always been answered correctly, namely, I5, I7, I11, I17, I20, I24, and I27. In
For a meaningful analysis, I should turn I2 and I21 into missing data, does that simply mean to remove them completely? as if the questions never existed?
linda: And for the person fit analysis? Are the results reasonable like that? With many of them overfitting the outfit? I'm very confused, even though I've read a lot of literature about this...
Mike.Linacre:
Linda, the person and item fit analyses are inter-dependent. So, changing the item fit will also change the person fit.
If we only saw your person fit table without your item fit table, we would say that the person fit is excellent. In fact, too good = overfit, because the average Outfit Mean-square is noticeably less than 1.0. We see results like these when some observations are imputed rather than observed. But, since we can see the item fit, we know that this overfit is artificially produced by the high misfit of items I2 and I21.
You write: "So I looked over these 2 questions, their responses seem fine for the naked eye." Linda, there must be something in the data to cause the Outfit Mean-squares for items I2 and I21 to be 3.4 and 3.8, which are huge values, indicating the presence of extremely unexpected responses. Can you produce a list of the most unexpected responses? If so, responses to these items should be at the top.
Yes, and please do analyze the data without items I2 and I21. Compare those fit statistics with the fit statistics above. We expect the person outfit mean-squares will average much closer to 1.0.
linda:
So I removed I2 and I21.....and redid the analysis...but the person outfit mean-squares aren't averaging closer to 1.0..what would that imply?
Also for the items fit, is the mean square error for questions I8 and I33 abnormal like that? The rest of the questions too have pretty small mean square error, does that imply that my model is overfitting the data? If I compute the rashmodel parameters (questions difficulty, person skill) based on the current input, will I get any sensible results in regards to the probability of a certain person answering a certain question correctly?
linda: person fit analysis
Mike.Linacre:
Linda, you may be experiencing the "dirty window" phenomenon. Please see
https://www.rasch.org/rmt/rmt234h.htm - also https://www.rasch.org/rmt/rmt234g.htm
gleaner:
What if item fit statistics ( infit and outfit MNSQ ) are within the productive measurement range (.5-1.5) while the person fit statistics are pretty bad, a lot of persons falling out of the range; or vice versa(item fit statistics bad, but person fit statistics good). Shall we just nose on those person infit and outfit statistics which are far larger than 1.5, say 2, or 3 first and anchor againthe person measure without those persons of bad infit and outfit MNSQ statistics with the person measures keeing those "bad persons"?
I suspect that bad person infit and outfit MNSQ statistics derive from probably short or too few items.
Am I right on this, Dr Linacre?
Mike.Linacre: Gleaner, if the bad person fits are due to random misbehavior they are probably having little influence of the overall set of measures. However, just in case, https://www.rasch.org/rmt/rmt234g.htm
linda: So I have to move pass the dirty window phenomenon in order for the rash model to compute sensibly? Without doing that, I would basically get completely incorrect output and estimations' of the person abilities and the question difficulties that don't really represent the underlying true values?
gleaner:
Shall I just run a scatterplot by cmparing person measure under original and bad-persons-removed formats, if there is little difference between the person measures under two formats. The bad fit persons could be held accountable for bad just because random misbehavior in responses.
However, the critical issue is how to select the range of bad persons. Acccording to help manual of winsteps, you recommend that the underfit persons with largest infit and outfit MNSQ values should be removed. It is noticeable that in order of misfit values, some uppercase letters A, B, C, appears beside the PT-measure Corre EXP, should all the persons marked with uppercase letters there be removed first? Then anchor with the person measures under the original format?
Thanks a lot, Dr Linacre. Sorry to be so rude to interrupt Linad's thread.
Mike.Linacre:
Linda, Rasch estimates can never be worse than the raw-score estimates of Classical Test Theory. So "completely incorrect output" is exceedingly unlikely unless there are miskeyed or reverse-scored items. These produce negative correlations, which is why Winsteps Diagnosis Menu A. reports on correlations as the recommended first step in a Rasch analysis.
Gleaner, mean-squares bigger than 2.0 indicate that there is more unmodeled noise than modeled information in the response string for person or items, so these are the first ones to remove. They would be the random guessers, response-setters, etc., in multiple-choice tests, or the deliberately uncooperative on surveys.
gleaner: Scatterplot of person measures of original and bad person removed ( all infit MNSQ larger than 2.0 )
gleaner: person measure of original data set
gleaner: person measure of bad person removed
gleaner:
Sorry to continue to be rude to interrupt Linda's thread
As the scatter plot indicated that most person measures fall outside the confidence interval band, they changed much. However, the plots for person measures respectively did not show much difference, since their general data spread trend remined roughly intact.
So removing persons did not change much. Am I right? Thanks a lot, Dr Linacre.
Mike.Linacre:
Gleaner, are you sure these plots are correct?
If strongly misfitting items and persons are removed then:
1) Cross-plotting the person measures (of persons in both analyses) should produce a strongly diagonal cloud of points with a slight curvature. The most off-diagonal persons are those most influenced by the misfitting items.
2) Cross-plotting the item difficulties (of items in both analyses) should produce a strongly diagonal cloud of points also with a slight curvature. The most off-diagonal items are those most influenced by the misfitting persons.
linda: hmmm so then what's the practical use of fitting the model to the data, if it's not to improve the resulting output of the model? If I completely skip the fitting, would the results still be valid?
Mike.Linacre:
Linda, please think about the same situation when cooking. We have a mental model of an apple pie. We have a bag of apples. We certainly want to check that each apple we put in the pie is not rotten, but we do not throw out every apple with a minor blemish. (If we did, we could discover we have none to put in the pie.) So the rule is "good enough for our purposes is good enough."
Analysts sometimes go to extremes:
1) include all the data - because it would be "unfair" not to
or
2) exclude everything except perfect data - because that gives the best data-model fit
However, when living their practical lives, analysts are quite willing to eat apples with minor blemishes, and to drive along roads with pot-holes.
mdilbone November 11th, 2013, 3:25pm:
Hi,
I am a graduate student working with the Rasch model for an exploratory measure of seed security. The model is made up of 20 items with frequency response of 0, 1, 2, 3 (0 least severe) and 456 people.
I have two questions:
1) One of the items, asking about new variety adoption, was posed as on inverted ranking item. So 0 would be most severe and 3 least severe. However, when I enter it with inverted rating the PTMEA correlation is -.19. I read that all correlations should be positive. So I am wondering is the model telling me that my assumption is wrong, that 0 is actually least severe? Or do inverted rating scale items normally have a negative PTMEA correlation?
The inversion makes a huge difference in the severity measure of this item.
2) What is the proper way to report item fit statistics for polytomous model. Right now I have reported a measure, infit mean-square, and outfit mean square for each item. However, I am unclear if this is only appropriate for dichotomous models?
Many thanks for the help
Megan
Mike.Linacre:
Megan, take a close look at that item. Was it really clear to the respondents that the rating scale is reversed? My suspicion is that half the respondents followed the intended instructions, and the other half followed the general trend of the rating scale. This often happens when test constructors try to prevent response sets by reversing items. Remember that a set of items is like a conversation. In the middle of a conversation, we do not suddenly switch the meanings of "yes" and "no".
2) Those fit statistics apply generally - see https://www.rasch.org/rmt/rmt103a.htm
For polytomies, it is usual that infit mean-square and outfit mean-square are telling almost the same story. If so, report only the outfit mean-square. This is a standard statistical chi-square (familiar to most statisticians and many non-specialists) divided by its degrees of freedom. The infit mean-square is an information-weighted chi-square, which is rarely used outside the Rasch community.
mdilbone:
Mike,
Thanks for the response.
I do not believe that respondents were confused by the question because I was posing all the questions in terms of frequency. How many times in the last 4 seasons has your household....
In the case of this item it was how many times in the past 4 seasons had your household grew a new crop variety? So the household frequency response fit into a range of frequencies each represented by categories 0,1,2,3.
However, it was my assumption as the test maker, that less frequency of variety adoption was more severe than more frequency of variety adoption. My decision to enter this item as an inversion was based on literature review and previous experience in the field. But not on a previously validated measurement of this item. So really I do not know for sure how this item should behave.
When I saw the negative correlation I was thinking my assumption was wrong and I should change the inversion of the item.
I am just wavering on this decision because it changes the item from being least to severe to most severe.
If I change the inversion based on the negative correlation is this valid?
Mike.Linacre:
Megan, the data is telling us that the assumptions about this item do not accord with the definition of the latent variable according to the other items.
Suggestion: weight the item at 0 using IWEIGHT=, then this item does not influence the latent variable defined by the other items.
In your Winsteps control file:
IWEIGHT=*
item-number 0
*
then run an analysis
Look at the distractor/option frequencies and average measures for this item in Table 13.3 - https://www.winsteps.com/winman/index.htm?table13_3.htm
You may observed that the "Average abilities" do not advance monotonically or that the frequencies have a strong U distribution. These would indicate that the item is either off-dimension (not part of the same latent variable as the other items) or is really a yes/no dichotomy not a polytomy.
Davide November 11th, 2013, 11:04am:
Dear all,
I'm using Ministep to analyze a questionnaire with 75 persons and 22 items (it's a pre-analysis, in future I will use more individuals using Winsteps).
I would need to get and export a 75x22 matrix containing residuals to perform further analyses. Since I can not find the option in the "Output File" menu, I tried to export just the expected scores using the option Output File > Expected scores on items. The output is a file containing a matrix with 24 columns (measures + scores + items) and... 101 rows! I don't understand because the rows are 101 instead 75: I have 75 persons and not 101!
Mike.Linacre:
Davide, the "Expected scores" are correct, but not doing what you want :-(
For the matrix, did you try "Output Files > Matrix files IPMATRIX="?
This displays: https://www.winsteps.com/winman/index.htm?ipmatrix.htm
Davide: Thank you very much Mike, this is exactly what I was searching!
uve November 6th, 2013, 9:46pm:
Mike,
For Between-Group fit in Table 30.4, Winsteps help provides the following interpretation: "The dispersion of the group measures accords with Rasch model expectations."
However, there is no such guidance for Summary DIF Chi-square. Could you please elaborate?
Mike.Linacre: Uve, these statistics were included in Winsteps output at the request of users. These statistics parallel similar statistics in RUMM. Here is an earlier document on the same topic: https://www.rasch.org/rmt/rmt211k.htm
uve:
Mike,
So in summary, the chi-square null is: "overall performance of the trait-groups fits the Rasch model"
How is this different than: "The dispersion of the group measures accords with Rasch model expectations."
In my analysis, the DIF is for different levels of employee status, management, teachers, support staff, etc., 6 groups in all. Am I correct in stating that the summary chi is comparing each group's empirical average with expected?
Mike.Linacre: Uve, sorry, I have not investigated the implications of the statistics in Table 30.4.
uve:
I guess I was ultimately attempting to reconcile the two statistics. For example, below is the output for 6 groups and 5 d.f. for one of the items.
6 28.1358 5 .0000 1.0149 .2343
So the summary chi is stating there is significance while the between group is not. Since both statistics seem to be stating very similar things, it's a bit confusing as to which one provides the better information.
So I guess it's a bit like trying to decide whether to use MH or the t-test for measuring DIF in table 30.1. I just wish the suttle differences were easier for me to see.
s195404 November 8th, 2013, 1:01am:
Dear all,
I'm very fond of the two editions of Applying the Rasch Model: Fundamental Measurement in the Human Sciences by Bond and Fox (2001, 2007). They refer to Joel Michell's work quite a bit, who has questioned some of the basic assumptions that social scientists make in devising instruments and analysing responses.
I've been reading a little of Prof Michell's work and found this comment in one of his papers (see below for the reference):
"An examination of some relevant textbooks [a list is given, including Bond and Fox, 2001] reveals a consistent pattern: the issue of whether the relevant psychological attribute is quantitative is never raised as a source of model misfit. Other issues, such as the unidimensionality of the underlying attributes, item-discrimination parameters and local independence, are raised, but item response modellers appear never to question that their attributes are quantitative."
(Michell, J., 2004:. Item response models, pathological science and the shape of error: Reply to Borsboom and Mellenbergh. Theory and Psychology, 14, 121-129)
This seemed a very good point to me and I'd be interested to hear some opinions on the comment. One conclusion we might draw is that, while the Rasch model potentially creates measures with useful properties, it may still be useless if an attribute isn't quantitative in the first place.
Thanking you in advance.
Regards,
Andrew Ward
Mike.Linacre:
An interesting, but erroneous, conclusion, Andrew. Rasch needs an attribute that is "ordinal". If we can say that one attribute of an object is "more" than the same attribute of another object in some sense, then that sense defines a latent variable along which Rasch can construct measures. For instance, if an observer says that the Pope is "nearer to God" than Bishop Smith, then we have a latent variable of "nearness to God" along which measures can be constructed. This example comes from https://www.rasch.org/rmt/rmt72d.htm
Rasch fit statistics tell us how well our ordinal observations of attributes of objects conform to the ideal of a unidimensional additive latent variable.
Michell appears to claim that some attributes are inherently quantitative. In all of science, cooking, etc., "quantities" do not exist naturally. They are not inherent. Quantities must always be constructed by the application of some rule. This is made explicit in such rules as "The Treaty of the Metre" - http://en.wikipedia.org/wiki/Metre_Convention . For Rasch, the rule is based on "ordinal comparisons".
EWinchip November 7th, 2013, 4:36pm:
Hello! I am new to Rasch analysis and loving every moment!
I have an interesting data set analyzing math scores from 5 units on four criteria (knowledge, pattern investigation, communication, reflection). I would like to see person measures for each of the criteria instead of just overall person measures. How can I get Facets to do that for me?
Would it be a job for anchoring?
If possible, I would like to take a next step of looking at the correlation between person measures and the grades given by the teacher. Should I just run a correlation with Excel or SPSS or is there a better way to look at the relationship?
Thanks!
Mike.Linacre:
Thank you for your questions, EWinchip.
"person measures for each of the criteria" - there are several ways of doing this. Anchoring is one way. Also, from the Facets "Output Tables" menu, request Table12-13-14 Bias/Interaction reports form persons x criteria. This will give the person x criterion values in Table 13, add (or subtract) these from the person measures.
A correlation in Excel sounds right to me.
Hamdollah November 6th, 2013, 9:09am:
I'm investigating construct validity of a General English test compose of four subsections. First, I checked the unidimensionality assumption. There were three contrasts with eigenvalues over 2 therefore I decided to analyze each subsection separately. Even within each section I found eigenvalues over 2. I divided the items into two subsets; those with positive loadings and those with negative loadings and cross-plotted the persons' and found a lot of off-diagonal persons, indicating lack of unidimensionlity. Do I take this violation as suggesting lack of construct validity?
When writing the research report do I need to mention the procedures I followed to check the unidimensionality of the whole test (such as simulation, cross plots, etc.) and also mention that since unidimensionality was violated I analyzed the sections separately?
Mike.Linacre:
Hamdollah, imagine we do this same thing with an arithmetic test.
Your step 1 will reveal addition, subtraction, multiplication, division, ...
Your step 2 within addition will reveal single-digit addition, multiple-digit addition, ...
So, multidimensionality is only indicated by statistics. Statistics are not decisive. Our intentions are decisive. For the arithmetic test,
if we are diagnosing learning difficulties, then each branch of arithmetic is different.
If we are considering grade advancement, then arithmetic is one topic.
For your General English test, what is its purpose? If it is formative (to assist with appropriate teaching) then it is multidimensional. If it is summative (to assess overall competency) then it is unidimensional.
Hamdollah: Many tanks for your clarification. But the test is part of a university entrance examination intended to be summative and a single percent-correct score is provided for the whole General English part for each the test taker. The problem is that there are a lot of misfitting items and persons and the Rasch model dimension explains only 17.5% of the variance while the test is expected to have a wide spread of items and persons. Using SIMUL option I generated similar data. The Eigenvalue for the firs contrast was 1.1 while in my data it is 2.4 for the first contrast. I devided the items into two subsets according to the +/- loading pattern and cross-plotted person measures there were a lot of off-diagonal persons. Does all this evidence suggest the test (considering the context) is invalid?
Mike.Linacre:
Hamdollah, a "university entrance examination" is almost certain to be multidimensional because it cannot be restricted to a narrow unidimensional variable. Your examination looks to be remarkably close to unidimensional considering the expect variation in the examination content.
The equivalent situation in physical measurement is when you mail a parcel. They cannot restrict measurement of the parcel to only one dimension, such as length. They must include multiple dimensions (length, width, girth, weight, etc.) when generating the number (price) on only one dimension (postage).
Hamdollah: Even when the test is considered multidimensional, within each dimension unidimensionality seems to be violated.Attached I have included a person cross plot of the vocabulary section. The data come from 18000 test takers. The eigenvalue for the first contrast was 1.7 whereas in the simulated data it was 1.2. Considering the test is summative, do I take this evidence as a threat to the validity of the test?
Mike.Linacre:
Hamdollah, think of the three main types of validity:
1) content validity: do the test items contain the intended content?
2) construct validity: does the item difficulty hierarchy match the intended hierarchy?
3) predictive validity: do the person measures on the test correlate with the intended outcomes?
If these are all true, then the very slight multidimensionality in the test is of no concern. Think of the same thing in building a house of bricks. Does it matter if some bricks are not exactly rectangular? No, as long as the house is robust and weatherproof.
Mantas November 6th, 2013, 8:10pm:
Hello,
Another hypothetical question:
I have two different, 10 question exams, exam A and exam B.
Both exams have been taken by 1,000 people,
Running WinSteps on both, I now have Question Difficulties for all 20 questions.
Am I allowed to create a new exam cherry-picking questions with difficulties from Exam A and Exam B?
For example:
A new Exam C would contain 8 questions from Exam A, and 2 questions from Exam B, along with their difficulties.
Is this allowed?
Thanks,
Mantas
Mike.Linacre: Mantas, you can "cherry-pick" provided that it is reasonable to say that the two samples of 1,000 persons are statistically equivalent, such as because of random assignment of people to tests. This is how alternate forms of the same test are usually designed to be administered.
Newbie_2013 November 5th, 2013, 3:01pm:
Dear Mike,
This is a bit off topic.
I am trying to get a hold of data for learning purposes to fit 1PL, 2PL, 3PL, and 4PL models. Might you happen to have access to data that you use for teaching purposes that you wouldn't mind sharing?
I have tried simulating data that conform to a 4PL, but I seem to be getting stuck.
Really, any dataset (even small) which a 4PL would fit would be great!
Thanks,
Newbie
Mike.Linacre:
Newbie, I don't have a 4-PL dataset, but here is one way to construct it:
1) simulate a 2-PL dataset
2) upper asymptote (careless mistakes): for all observations where the generating difference between person and item locations is higher than x probits, replace correct answers by incorrect answers at random. For instance, roughly 1 in 5.
2) lower asymptote (lucky guesses): for all observations where the gernerating difference between person and item locations is lower than -x probits, replace incorrect answers by correct answers at random. For instance, roughly 1 in 4.
Erik54 November 5th, 2013, 2:01pm:
Hi I have som questions about targeting and standard errors on items and thresholds.
As I understand it, should items which are located in areas with few respondents on the latent trait have larger standard errors (SE) than items located near the persons mean location. From experience, what is a large SE? My best targeted item has SE(0,069) while my worst has (0,075). Is this something to report?
Since I have polytomus data, should I report the thresholds location and (SE) instead?
My point is to show (in a master thesis) that the SE of the items/tresholds are affected by their targeting..
Mike.Linacre:
Erik, are those standard errors in logits? If so, they are small. You must have a large sample size.
In fact, those standard errors are too small to be believable. They are like measuring our weights to the nearest gram. We can do it, but we know that next time our weights will be different by more than one gram, probably much more.
In practical situations, when the S.E. is less than 0.2 logits, we know the location of the item difficulty precisely enough.
Yes, item S.E.s are influenced by (a) person sample size, (b) person sample distribution, (c) item-sample targeting. So that usually the more persons there are near the item's difficulty, the lower its S.E.
Polytomous items are more complicated because each threshold has as an S.E., so generally the larger the number of observations in the adjacent categories, the smaller the S.E. of the threshold between those categories.
gleaner November 5th, 2013, 3:50am:
In optimizing rating scale effectivness, it was said that step difficulty should advance, but it is pity that one of the categories, i.e. category 3 doesn't. Probably, collapsing categories would be a sensible approach, yet should 2 and 3 are collapsed together or 3 and 4? Are there any rules on collapsing?
Second problem is that observed averages for 1, 4, 5 are slightly larger than expected averages. According to the guidline you kindly provided, this is not good. What steps should be taken to analyze data, since you provided 3-step procedure to iron out the issue in the help file of Winsteps.
Thanks a lot, Dr Linacre!
Mike.Linacre:
Gleaner, thank you for your questions.
1) the differences between the observed and expected averages are miniscule. Please ignore them. In Rasch work, discrepancies of less than 0.5 logits are usually inconsequential.
2) Step difficulty Table:
a) the category frequencies are large and form a nice unimodal distribution
b) the observed averages advance and are close to their expectations
c) the category fits are good, all the mean-squares are close to 1.0
So why is there a problem with category 3? - Actually there isn't!
Remember that the structure calibrations (step difficulties, Andrich thresholds) are between categories. -.88 is between categories 2 and 3. It is reversed with -.36 the threshold between categories 1 and 2. So we need to focus our attention on category 2.
What would we have liked to see in the data and this Table that would have made the thresholds for category 2 become ordered?
Please make a guess before reading my next sentence ....
My answer: more observations of category 2! Threshold become disordered when there are too few observations in a category. My guess is that if category 2 had 16,000 observations, instead of 11,519, then the threshold would have been ordered.
There are only 11,519 observations instead of 16,000, because category 2 is too narrow. If we had given a wider definition to category 2, so that it is a little more likely to be observed, then all the thresholds would have been ordered.
Question to you: is the difference between 11,519 and 16,000 observations in category 2 important enough to you ...
a) to mess up all the other nice statistics that we see in this Table, and
b) to force the construction of a composite category: 1+2 or 2+3 which will probably be difficult to communicate to your audience?
What if you decide to combine? 1+2 or 2+3? Look at the category frequencies. Which gives the smoother unimodal distribution? The answer should jump out at you!
gleaner:
Yes, misunderstanding of the concept of structure calibration leads to wrong conclusion.
Thanks a lot, Dr linacre, for your detailed and kind reply!
I feel that combination of category 1 and 2 would be more sensible. Becasue the remaining 5 categories would be normally distributed with unimodal. Right?
YES! Indeed, if collapsed, there would be more work focused on explanation of new categores, e.g. how to name them all?
So I have a bigger question on optimizing rating scale category effectivess that you authored and published on Journal of Applied Measurement 2002, and 2004 on Introduction to Rasch Measurment as a chapter( cited 400+ times according to Google scholar) , you listed 8 guidlines, but you listed some of them as essential some of them as helpful, warned the readership that some of them may not be met and some may run against the others. So may I count those that you listed as essential as the MUSTs for good and practical guidlines that every valid rating scale must stand up to? Ten years on, do these guidlines still remain the same? If not, any changes would you like to make on them?
Thanks a lot!
Mike.Linacre:
Gleaner, a good change would be to substitute another English word for "guideline" that emphasizes that they are guidelines, not commandments.
Here is the statement about Medical Guidelines - http://en.wikipedia.org/wiki/Guideline_%28medical%29 -
"A healthcare provider is obliged to know the medical guidelines of his or her profession, and has to decide whether or not to follow the recommendations of a guideline for an individual treatment."
It is exactly the same with Rasch guidelines. We should know them, but the extent to which we follow them depends on the situation.
gleaner:
Thanks a lot, Dr Linacre. Hope to see more revision of the paper.
I like that paper very much.
At least the paper offers a kind of roadmap for Rasch outsiders to look at when groping in the dark when it comes to validate or optimize self-made rating scales.
gleaner November 4th, 2013, 1:21pm:
It is very difficult to copy and paste Winsteps tables, plots from Winsteps to Word, though fonts have been set to Courier New and Font size to 6. I wonder how to copy and paste neatly the plots and the tables etc to Word, spewed out by Winsteps. I am overwhlemed by the beauty of plots thrown up by Winsteps, but I can't copy them to word while keeping them in neat order.
I know one fast and easy method, i.e. snagit as pictures from Winsteps results to word, beiside that are there any methods of doing that?
Thanks a lot! I found that Dr Linacre, you did that neatly in my previous thread on analysis of survey by copying and pasting contrast residual plot with grace and order. How do you make it?
Mike.Linacre:
Gleaner, https://www.winsteps.com/winman/ascii.htm makes some suggestions abut prettifying your output.
You write: "though fonts have been set to Courier New and Font size to 6"
Comment: your spaces are probably "breaking", so globally replace spaces with "non-breaking" spaces: ^s
in this Forum, my plots are either
1) formatted using Courier font and usually a reduced size
or
2) copied using software similar to Snagit so that the plot can be annotated
gleaner: thanks a lot, Dr Linacre!
Mantas November 4th, 2013, 6:27pm:
Hello,
I have a question regarding Manually Changing a Difficulty of a Question/Item.
For example: I have a 10 question test, and 10 examinees who have taken the test.
Based on the results of the initial 10 examinees, running WinSteps,
I now have Ability Measures for each Test Taker, and Item Difficulty Measures for each question.
Now that I have predefined difficulties for this test, I can anchor them
(LINK File *.fil, referenced in my control file IAFILE=LINK.FIL)
All the questions within my test now have anchored difficulties allowing my to grade a new test taker individually,
based on the item difficulty measures of the initial 10 test takers.
Are all the question difficulties related to one another in some way?
If I decide to manually change one difficulty within the 10 questions, does that break the rules of the Rasch Model?
Thanks,
Mantas
Mike.Linacre:
Mantas, Rasch is "Conjoint Measurement". All the item difficulties and person abilities are measured together on one latent variable in one frame of reference. They are all related.
However, all the ability and difficulty locations on the latent variable are estimates. With only 10 observations of each item and of each person, the precision of the estimates is low. Their standard errors are high. Accordingly, you may well be able to improve the estimate of the location of an item or a person item by manual adjustment. For instance, with only 10 observations, a lucky guess or careless mistake could distort the estimates. Adjusting for the distortion would improve the locations.
Mantas:
Thank you for your prompt response Mike.
gleaner October 7th, 2013, 1:37am:
The questionnaire is created out of some theoretical construct. It contains five factors that have three testlet style prompt to measure the respondents' attitude. The example question is like the following:
Strongly Disagree=SD Disagree=D Agree=A Strongly Agree=SA
1 I feel thrilled upon completing the task format successfully
a listening 1SD 2D 3A 4SA
b reading comprehension 1SD 2D 3A 4SA
c composition 1SD 2D 3A 4SA
d cloze 1SD 2D 3A 4SA
2 The task format is critically important for passing the test
a listening 1SD 2D 3A 4SA
b reading comprehension 1SD 2D 3A 4SA
c composition 1SD 2D 3A 4SA
d cloze 1SD 2D 3A 4SA
.......
But I doubt if Rasch or winsteps could validate the style of questionnaire. If Rasch could, how do I have to do this? I am pretty interested to find out how the rating scale works under the style of prompt. In the Winstpes help file testlet topic catches my eyes, but there is little else beyond that. Thanks a lot, Dr Linacre and any Rasch friends.
Mike.Linacre:
Thank you for asking about this type of questionnaire, Gleaner.
The first stage here is to verify the theoretical construction of the questionnaire. Often, theoreticians perceive structures to which the respondents are oblivious. So start by doing a straight-forward "partial credit" analysis of your items. "Partial credit" means "each prompt/item defines its own rating-scale or dichotomous structure". In Winsteps, ISGROUPS=0.
You may discover that some items have negative point-measure correlations (Winsteps Diagnosis Menu, A.). If so, instruct Winsteps to reverse score them using RESCORE= and NEWSCORE=, then reanalyze.
Look at Winsteps Table 2.2. Do the rows for each prompt/item look roughly the same, but moved left or right? If so, the items share the same rating-scale structure, and you can switch to the Rating Scale Model. In Winsteps, omit ISGROUPS=
If groups of them share the same structure, then use ISGROUPS=(put grouping details here).
Next, a dimensionality analysis of the data, Winsteps Table 23. This is the crucial stage. Winsteps will report in Table 23.1 onwards the factors/components/dimensions/contrasts in the data, starting with the biggest contrast. We expect Table 23.1 to report the most prominent factor in the data (top or bottom of the plot) contrasted with everything else (bottom or top of the plot). Then the same thing for the next factor a few subtables latter in Table 23, and so on.
It is usual to discover that the original 5 factors collapse to 2 or 3 empirically different components, and that the empirical relationships within each testlet are no stronger than the relationships between testlets. If there is a strong relationship within a testlet (= high local dependency), then either analyze the testlet on its own, or collapse the testlet into a rating-scale item with ratings = score on the testlet/
gleaner:
I ran a test over dataset using ministep with 75 persons and 25 items. However, there is no negative point measure correlation. Anything wrong? Should I run the full dataset?
By the way, how do I reverse items of point measure correlation with RESCORE=? In specifications tab over the winsteps?
Thanks a lot, Dr Linacre!
Mike.Linacre:
Gleaner, nothing wrong so far :-)
For more advance instructions, such as RESCORE=, we edit the Winsteps Control file directly. (It is a text file). Winsteps Edit menu, top entry.
Enter the name of the control file, and then "Edit", "Edit control file". Please see Winsteps Help for exact details of RESCORE=, NEWSCORE= and the hundred other advanced commands.
gleaner:
Thanks a lot, Dr Linacre!
I have done, as you instructed on 2nd floor, ran my full data with winsteps.
The attached is the table 23.1-99.
It seems that the results indicated my data has two dimensions. Is it right that the results indicated that my data set has two dimensions? I am a bit confused in interpreting the number of dimensions. Is there any rules of thumb in interpreting the dimensions of data set? However, in reading the winsteps help file thses days, I found that deciphering dimensions or components is largely a matter of statistics as well as research-oriented( diemensions are always there, but it should never upset Rasch measurement).
I find that some of items are highly locally dependent in Table 23.99. As you wrote in help file part for table 23.99, you said that correlation between items larger than .7 would be regarded as good ( keep them after seeing if item fit is fine) or drop them ( since they violate the essential rule of Rasch measurement, i.e. local independence). But as far as I see, these 10 groups ( 20 items) highly locally dependent items are part of certain prompts for measuring attitude towards some item formats.
After detecting dimensions, how can I allocate items into different dimensions? I am curious about finding out how persons perceived different item formats.
Sorry to trouble you so much on the thread! Thanks a lot!
gleaner: BTW, there is no negative point measure correlation in the full data set. The items share the same rating-scale structure.
Mike.Linacre:
Gleaner, there is very clear dimensionality/strands/local dependency(?) in your data. Here is the first plot from your Table 23. Notice the obvious vertical stratification of the items. This contrast between the two sets of items has an eigenvalue of 22 = the strength of 22 items in a questionnaire of 240 items. This is big! Suggestion: Analyze the two sets of items separately and cross-plot the person measures. We expect to see a cloudy relationship between the two sets of measures.
STANDARDIZED RESIDUAL CONTRAST 1 PLOT
-1 0 1
-+--------------------------------+--------------------------------+- COUNT
.7 + | A MIN B + 2
| | KLC JDGH E | 12
.6 + | Q U OSVFP RT + 8
C | |1W YZ11 X 11 | 9
O .5 + |2 1 1 1 1 + 6
N | | 1 | 1
T .4 + 1 | 1 + 2
R | | |
------------------------------------------------------------------------------
A .3 + | +
S | | |
T .2 + | 1 1 + 2
| 1| 11 1 1121 | 9
1 .1 + 1 2 | 2 1 21 1 1 + 11
| 1 21|11 1 11 1 | 10
L .0 +----------------------2--1-2-1---1---------1---11------------------+ 10
O | 1 1 12111| 11 | 10
A -.1 + 212 21 11 51313 111 1 + 27
D | 1 1 1122 14111 2 11 | 13 12 1 2 | 30
I -.2 + 1 2 114 131 11 1 1 21 1 1 1 + 24
N | 1 1 32 2 1 11121 |1 1 2w1 21 1 | 25
G -.3 + 13 1 1 1t 1111x1uy1z2s1 v + 24
| qpo h mj | lirn k | 11
-.4 + c b d| g fe + 6
| a| | 1
-+--------------------------------+--------------------------------+-
-1 0 1
The next plot, in Table 23.7, also has a strong structure, but a different interpretation. It is what we see when a latent variable changes its meaning between low person measures and high person measures. Winsteps Example0.txt has this same structure, but not so strongly.
STANDARDIZED RESIDUAL CONTRAST 2 PLOT
-1 0 1
-+--------------------------------+--------------------------------+- COUNT
.6 + | +
| 1 1 | | 2
.5 + 1 1 2 | + 4
C | 1 1 1 | | 3
O .4 + 1 1 112 1 | + 7
N | 1 31p3q1 1 1 | | 11
T .3 + 1 122212o2 | + 16
R | 11 1 1 111| 1W | 9
A .2 + 2121 11213214112 Q L + 27
S | 12 121 12 2 2 Y UK | 17
T .1 + 1 113 1|12 1Z C A1 M + 15
| 1 h1133 | 11 NDI B | 14
2 .0 +-----------------------------111-|11---1--1-OSVG-1-----------------+ 15
| 1t 1 12 1 FJH 111 | 13
L -.1 + b2j1| 2 1 P 1 + 10
O | a| 1z1e21 1 X E | 10
A -.2 + cm 1d| g1r13 RT + 14
D | | y1 111 111 1 | 8
I -.3 + x1u2 n1 1 11 + 11
N | |1 li 2 1 1 1 | 8
G -.4 + | 1f 1w1k2 211 + 12
| | s 1 11v | 5
-.5 + | 1 3 11 11 + 8
| | 1 | 1
-+--------------------------------+--------------------------------+-
-1 0 1
ITEM MEASURE
gleaner:
Thanks a lot for your prompt advice on my questions!
Yes, indeed, I made a cross plot of ve+ and ve- person measure. It looks rather like a cloud.
But seemingly they have a kind of trend as the red dotted arrow indicated that the two dimensions are different yet slightly correlate positively with each other, is it sound to interprete this way?
gleaner: You said that table 23.7 has a strong yet different interpretation. What would that interpetations be? Thanks a lot!
Mike.Linacre:
Gleaner: Correlation: yes. Yuor plot is like height and weight. A general trend, but definitely different.
Table 23.7, as I wrote, the latent variable changes its meaning between low person measures and high person measures.
In math we see this. This latent variable is "practical and concrete" at the low end (e.g., addition) and "theoretical and imaginary" at the high end (e.g., set theory).
In Example0.txt, the "liking for science" variable is "fun activities" at the low end to "mentally demanding activities" at the high end.
gleaner:
Table 23.7 is indeed refelcting what the current researcher is interested, attitude. The different interpretation could be held as a kind of construct vadlity evidence, couldn't it?
Thanks a lot. I am grateful to your kindly and prompt help on this.
The above two plots belong to different standardized contrast of residuals. Why do we have to continue to have the other standardized constrasts of residuals since we have the first contrast one and have found the second dimension. Please forgive my silly question. Since as the help file said, the first standardized contrast of residuals has falsified the hypothesis that residuals are random noise. What is the use of having further contrasts?
Thanks a lot again.
Mike.Linacre:
Gleaner, yes, it would make sense to stop at the first plot, split the items, and perform two separate analyses. However, we can see from the pattern in Table 23.7 that it is likely that both the separate analyses would produce plots like that one.
A thought: There has been a big change in the way that statistical analysis is done. Before easy access to computers (for most researchers only 30 years ago), we did as little computation and as much thought as possible. Now it is different, we do lots of computation and relatively little thinking, hoping that the findings we are seeking will jump out at us from our computer screens. And they often do :-)
gleaner:
Thanks a lot!
I find that there are some changes in plots of STANDARDIZED RESIDUAL CONTRAST with each contrast changing. Are the further contrasts of residuals based on the 1st contrast of residuals? When do the further contrasts of residuals stop? Are there any rules on this? Until the unidimension pops up?
Thanks a lot !
Mike.Linacre:
Gleaner, we are doing a Principal Components Analysis of the Residuals. All the Contrasts (Components) are orthogonal, explaining variance in the residuals. Each one is smaller than the previous one, and there are (number of items - 1) of them.
We have definitely run out of dimensional contrasts when the eigenvalue is less than 1.5, and usually less than 2. A dimension with less than the strength of 2 items is not really a "dimension".
Table 23.2 shows a contrast between items on two different dimensions.
Table 23.7 shows that the dimensions slightly change their meanings as the latent variable increases.
Table 23.12 shows a splatter of off-dimensional items contrasting with most of the items. We would need to examine the item content to determine whether theses are really off-dimension or just on another strand (like "arithmetic" vs. "word problems").
Table 23.17, 23.22 - the same as Table 23.12 only weaker.
Ultimately, every item defines its own dimension. This is because every item must have some uniqueness that distinguishes it from the other items. In Rasch theory, we want items that share the same dimension, but otherwise are as different as possible. These differences will load on many different dimensions.
gleaner:
Table of STANDARDIZED RESIDUAL variance (in Eigenvalue units)
-- Empirical -- Modeled
Total raw variance in observations = 306.7 100.0% 100.0%
Raw variance explained by measures = 66.7 21.8% 22.2%
Raw variance explained by persons = 8.9 2.9% 3.0%
Raw Variance explained by items = 57.8 18.9% 19.2%
Raw unexplained variance (total) = 240.0 78.2% 100.0% 77.8%
Unexplned variance in 1st contrast = 22.1 7.2% 9.2%
Unexplned variance in 2nd contrast = 17.0 5.5% 7.1%
Unexplned variance in 3rd contrast = 8.5 2.8% 3.5%
Unexplned variance in 4th contrast = 6.7 2.2% 2.8%
Unexplned variance in 5th contrast = 6.0 1.9% 2.5%
However, as I found that, in the above table 23.0, the last contrast 5 th one still captures something euqal to 6 items that are off dimension. Why did Winsteps stops there and then, though the eigenvalue is far from less than 1.5.
Thanks a lot!
gleaner:
As I found at the very bottom of the tables, Table 23.99 showed only a couple of items that indicated strong local dependence. Need the items that suffered from local dependence be removed from the later analysis since they violated the rule of Rasch, i.e. local independence? or further careful analysis is done before removing them all?
Thanks a lot!
Mike.Linacre:
Gleaner, if two items have strong local dependence, then you would only remove one of them. However, if you cross-plot the person measures produced from analyses including and excluding the omitted item, you will likely see that all the persons are closer to the diagonal than their standard errors.
If you are analyzing high-stakes data that has already been collected, then omitting the item makes no practical difference. However, it often makes an operational difference when explaining your findings to your audience, especially if the omitted item relates to content that is, for instance, crucial to the curriculum.
If you are pilot testing a new instrument, the two items are duplicative, so you are wasting everyone's time if both are in the test instrument.
gleaner:
However, from the wording of the items it is easy to find that the highly local dependent item groups are closely related item formats and embeded under the same prompt sentence( every group of highly local dependence items share one prompt sentence).
Therefore I doubt if they are true duplicatives. Probably, they are accounted as duplicatives simply because they are treated as the same item format, i.e. the respondents have the roughly same attitudinal reponses toward these item formats. Does this explanation make sense?
Thanks a lot!
Mike.Linacre:
Yes, gleaner that makes sense.
Each prompt may be acting like a testlet. If so, the sum of the scores for each highly locally-dependent item group should be analyzed as a partial-credit superitem rather than as separate items. https://www.winsteps.com/winman/index.htm?testlet.htm
gleaner:
Table of STANDARDIZED RESIDUAL variance (in Eigenvalue units)
-- Empirical -- Modeled
Total raw variance in observations = 306.7 100.0% 100.0%
Raw variance explained by measures = 66.7 21.8% 22.2%
Raw variance explained by persons = 8.9 2.9% 3.0%
Raw Variance explained by items = 57.8 18.9% 19.2%
Raw unexplained variance (total) = 240.0 78.2% 100.0% 77.8%
Unexplned variance in 1st contrast = 22.1 7.2% 9.2%
Unexplned variance in 2nd contrast = 17.0 5.5% 7.1%
Unexplned variance in 3rd contrast = 8.5 2.8% 3.5%
Unexplned variance in 4th contrast = 6.7 2.2% 2.8%
Unexplned variance in 5th contrast = 6.0 1.9% 2.5%
However, as I found that, in the above table 23.0, the last contrast 5 th one still captures something euqal to 6 items that are off dimension. Why did Winsteps stops there and then, though the eigenvalue is far from less than 1.5.
Thanks a lot!
Mike.Linacre:
Gleaner, Winsteps has an upper maximum of 5 contrasts. If you need more, please use the ICORFILE= correlation-matrix output and your own statistical package, such as SAS, SPSS.
However, it would make more sense split the items based on the first contrast and do two separate analyses. Each of these would have 5 contrasts reported. Split the items again bast on those analysis, and so on. Then, in each analysis, random noise from the excluded items would not distort the structure of the items on which you are focusing.
gleaner:
Thanks a lot, Dr Linacre.
I tried to create testlets out of data collected, yet the first column of data mixed with Person data, so there is one column of data short i.e. the last column of data goes to the next to the last column. See? What is wrong? I can't find out if anything is wrong. I have checked my control and data file with Winsteps, It does work well with the control and data file. Is it a bug?
gleaner: Control and data file
Mike.Linacre: Gleaner, please look at column A of the Excel file. It contains two variables. Please move all the other columns of data (not headings) one column to the right, and split column A data into columns A and B.
gleaner:
Yes, that is the problem. I have found that. However, checked both control data file and procedures instruted in winsteps help file you kindly provided, I found that no steps went wrong. Is this problem caused by wrong control & data file writing, or something else?
I have worked a whole night trying to figure out the reason why the problem popped up. Yet failed. uhhhh!
Mike.Linacre:
You are right, Gleaner. This is almost certainly a bug in the way that Winsteps outputs the file to Excel. Communicating with Excel is remarkably difficult because there are so many versions of Excel, and they communicate through so many versions of Windows. Microsoft has failed to maintain a consistent communications protocol so Winsteps has to do the best it can. Unfortunately, in your Excel file, Winsteps came up short :-(
It looks like Winsteps and Excel disagree about the column separator between columns A and B in the data. I am investigating. In the meantime, please adjust the columns yourself.
gleaner:
Thanks a lot!
If the problem is caused by a bug, then I will forget it, because I worried if that was my fault.
No, Winsteps work magic. YOU are a master of masters. Thanks a lot!
I am working on combining sub-items together.
I really appreciate your help on the thread. My appreciation is beyond words.
gleaner:
I plotted separately person measures for standard items (without collapsing all the items) and testlet or super-items ( collapsing them all into groups), compared them both in scatterplot.
It is interesting to note that logit spread ( person measure by standard items) is larger than that by testlet items ( person measure by testlet items).
According to winsteps help file, there is local dependence among the items.
gleaner: Measure for testlet items
gleaner: plot identity line
gleaner: plot empirical line
Mike.Linacre:
Yes, Gleaner that is definitely a symptom of local dependency. The effect of local dependency is to spread the estimates in terms of logits. However, it is interesting that the trendline is essentially straight. For most purposes, decisions made on both data formats would be the same.
Since the data is the same for both axes, the standard errors are not independent, so the confidence intervals are too wide, but we can already see that there are only a few outlying points. It would be instructive to investigate these to determine which axis is telling the truth.
gleaner:
Thanks a lot, Dr Linacre.
You mean that there is a clear tendency of local dependence, but apparently, the standard and the testlet made no significant differences over data.
I am working on this quirky part. Probably expert judgements will help in part.
I will come back with my finding.
Mike.Linacre: Yes, Gleaner, this is an interesting, and potentially important, investigation. You definitely have a publishable Paper here, or a Ph.D. Dissertation.
gleaner:
I am a green hand in Rasch though I have been following your research and forum for a couple of years.
By interacting with you with my own data in this forum, I find it more effective than reading winsteps help file, and palying with data files in your example file. It is more illuminating.
I am working on this. Your words are an encouraging pat on my back!
gleaner:
These two days, I have been palying with data and thinking about the reason why the standard and the testlet formats didn't behave as the last picture of the winsteps help file for testlet https://www.winsteps.com/winman/index.htm?testlet.htm.
Dr Linacre, your explanation is the abnormal responses from the outliers.
However, I reason that the raw scores behave similarly in the two formats standard and testlet because in quesitons, only prompts change, subitems remain the same.
For example
Prompt A ( attitudinal descriptors)
A Item type 1
B Item type 2
C Item type 3
Prompt B ( attitudinal descriptors)
A Item type 1
B Item type 2
C Item type 3
Therefore, though I have different prompts. But the item types I want to invetigate remain the same. so when summing them up, their score will largely remain the same.
Does this make sense?
Mike.Linacre:
Gleaner, the mystery is Why do the raw scores change at all?
We expect the slope of the trend line to change, because that is why we are collapsing the testlets.
We don't expect off-diagonal points, because these are points for which the raw scores have changed. Why?
gleaner:
I recalculated the measures in the standard format and the testlet format. It surprised me that when calculating the trendline slope, the trend line slopes are different in plotting the person measure trendlines under two formats ( standard and testlet) . It is evident from the trendline and the slope information.
gleaner: person measure under testlet
gleaner:
So the trendlines under two formats do change.
However, off-diagonal points are still a mystery.
Probably checking them one by one is a must.
gleaner: I have been checking the outliers that are off diagonal. Howver, there seems to be no meaningful find. Is it OK that I simply delete those off-diagnal respondents in analysis, since their responses are unexpected?
Mike.Linacre: Gleaner: why are they off-diagonal? My guess is because their raw scores have changed, but why? Please investigate: are most raw scores the same for the two formats, but some raw scores are different? If some are different, why? This could indicate an important feature of the testlets that may alter their design.
gleaner: Thanks a lot for your kind and prompt reply I will come back with my finding!
gleaner:
Ureika!
Probably it is because that in the preliminary analysis of standard format of all 240 items, the missing value stay there without any imputation applied, then when being collapsed, summed and combined, the missing values will be counted as zeroes in Excel calculation. It is in the transformation that casused the changes of raw scores. It is only hypothesis. I will get it plotted by controlling the missing values. Does this make sense?
gleaner:
Yes, indeed.
The problem that the previous person measures under standard and testlet formats plot unexpectedly just because the missing responses in the data file are left just as blanks, since I was told that Winteps would not care so much about missing value.
When the missing values are imputed as 0 ( in computation of person measures under two formats control and data file are added "MISSCORE=0 missing responses are scored 0") then the plot is as follows,
Mike.Linacre:
OK, Gleaner, then all is explained! The problem is the ambiguous status of missing data.
If there is missing data in a testlet,
either the entire testlet must be omitted from both formats
or missing data must be scored 0 in both formats
otherwise the meaning of the measures has changed between formats.
If you want to maintain missing data as "not administered" for individual items (the Winsteps default) then that invalidates measures based on the testlet format.
Omitting persons from the analysis who have missing data is another solution. You can calibrate the item/testlet difficulties without them. Then anchor the items/testlets at their calibrated values and reinstate the omitted persons, scoring them in any way you want. The idiosyncratic scoring of those persons will not alter the item calibrations or the measures of the other persons.
gleaner:
thanks a lot, Dr Linacre!
The missing values hasn't been any problem.
Perhaps you are right. Missing responses should not be left blanks in the excel sheet, instead, they should be coded as 0 and when in calibration, missing value code should be told to Winsteps for calculation.
GiantCorn October 30th, 2013, 7:54am:
Hi Mike,
I have data on 60 students who each sat two English speaking tests, one at the beginning of term, one at the end. Each time the student sat the test with a different partner, and conversation topic. tests were video taped. Each student will be rated by 4 raters on three scales. Raters will watch videos in a pre-set random order making it more challenging to guess which performances were first or second thus avoiding bias (hopefully).
I would like to investigate their improvement in speaking proficiency and so need to two measures for each student. I must create two separate Facets spec and data files correct one for pre-course test data and another for post-course test data?
Also raters will complete the ratings over three or four sessions taking perhaps 2 or three weeks of time. would it be wise to include a facet for rating sessions? Could rater drift be an issue in this instance in your opinion?
Does all this sound reasonable?
Thanks again
GC
acdwyer77 October 25th, 2013, 1:05pm:
I work for a company that analyzes data from standardized tests (mostly multiple choice items, but some polytomous items as well).
I currently use SAS to pull data from our Oracle database, then I clean and restructure that data so that it can be imported into Winsteps. Then I open use Winsteps to perform the Rasch analysis (calibrate items, obtain person scores, etc...). Finally, I import the Winsteps output files back into SAS to create graphs and tables for the reports I need to produce.
My question is this... has anyone out there ever created a SAS program that will create a Winsteps control file AND call Winsteps to read and run that control file? It would be awesome if I didn't have to manually open Winsteps. I feel like this is a real possibility, but I'd love to not have to recreate the wheel if someone out there has already done something like this.
Thanks!
Mike.Linacre:
acdwyer, your wish has been granted ...
www.estat.us/sas/Running%20Winsteps%20with%20SAS.doc
acdwyer77: AWESOME!! Thanks!
moffgat October 24th, 2013, 11:15am:
Hello,
working with facets I use the Option to save the "Score and Measure files" as SPSS or Excel from the "Output Files" Menu. However I want to do this automatically for batch processing so I want to add a command to the controll file to save these files as SPSS and/or Excel. Up to now I found the "Scorefile = XXX" Command but whatever I put in for XXX, always a plain textfile is saved. How do I tell facets to save the Scorefile as SPSS or Excel and if its possible can I also tell facets to save both, SPSS and Excel versions?
Thank you in advance
Yours Frank
Mike.Linacre:
Frank, thank you for your question. I have never tried this, so am investigating.
In Batch model, Facets can only output one version of Scorefile=, Residualfile=, and other output files.
moffgat:
Thank you very much, would be great if you find a way to do it.
Yours Frank
Mike.Linacre:
Frank, a relatively fast way to output to Scorefile= in Batch mode:
in batch mode:
1) analyze the data and output an anchorfile= and one scorefile=
2) analyze the data using the anchorfile= as the specification file and output another scorefile=
moffgat: I see this way I can get double scorefiles as output. Now I just need to know how to output it as an SPSS file.
Mike.Linacre: Sorry, Frank, SPSS output is currently only from the Output Files menu. Scorefile= to SPSS is now on the wish-list for the next Facets update.
moffgat:
Thank you for the feedback. I will for now find a way to work around that and wait for the implementation in the future.
Yours Frank
marlon October 15th, 2013, 1:57pm:
Dear Friends,
I would like to apply Rasch model to the test of 34 items coming from the test in which scoring system was the following:
1 for correct answer
0 for lack of the answer
-.5 for wrong answer
I was thinking about Partial Credit Model but at the moment I am not sure about this scoring system to the Rasch model. What do you think?
Thank for suggestions!
Marlon
Mike.Linacre:
Marlon, you could score the way you suggest, but this way in Winsteps:
3 for correct answer
1 for lack of the answer
0 for wrong answer
and
STKEEP=Yes ; this tells Winsteps that "2" is an intentional, but unobserved, category
You could try the Partial Credit model first, ISGROUPS=0.
Then look at Table 2.2. If the pattern of all the horizontal rows looks about the same, then switch to the Rating Scale model, by omitting ISGROUPS=
marlon:
Dear Mike,
Thanks a lot for your answer. However, I see potential problem is with convincing my public to PCM model. They might claim that the test was designed that way (with negative points for wrong answers) just to deliberately penalize students for guessing.
Thus, I am not sure if any of Rasch family models can address somehow this issue?
Regards,
MG
Mike.Linacre:
Marlon, 0-1-3 will give the correct Rasch measures for -.5 - 0 - 1. So report the raw scores using -.5 - 0 - 1 and the Rasch measures estimated from 0-1-3.
This is a frequent situation. For instance, Olympic Ratings use decimal points, such as 5.7. We analyze these as integers 57, but report the raw scores based on the original ratings.
marlon:
Mike,
Thank you very much for your reply.
In these days I was trying to check in the literature how to justify the sitaution that in in the scoring system you propose to apply the result 2points is impossible to be found in the data. I think it is the most difficult point of the reasoning for PCM or RSM.
May I kindly ask for some further reccomendended readings on such a situation?
All the Best!
Marlon
Mike.Linacre:
Marlon: Rasch operates on the range of possible from total scores from minimum possible to maximum possible. The test has 34 items. The item scores are
1 for correct answer
0 for lack of the answer
-.5 for wrong answer
So the possible score range is -17 to 34. This will give exactly the same Rasch estimates as a score range of 0 to 112 with item scores 0, 1, 3. This is because Rasch is based on the ordinal values of the item scores, not on their fractional values.
For instance, if dichotomous items are scored 0,1 or 1,2 or 0,100 or 50, 73, it makes no difference. The Rasch estimates are the same. The dichotomous Rasch model can be written:
log (Probability of higher item score) / log (Probability of lower item score) = Ability of person - Difficulty of item
The actual values of the "higher item score" or the "lower item score" makes no difference. So we usually choose 0,1 for convenience.
Your situation is a little more complex, because there is a rating scale (partial credit scoring). But the Rasch models are essentially the same:
log (Probability of a higher item score) / log (Probability of its immediately lower item score) = Ability of person - Difficulty of item - (Score-threshold for the higher item score)
Again, the actual number that indicates the "higher item score" makes no difference. So we usually choose 0,1,... for convenience.
Readings: perhaps a place to start is https://www.rasch.org/memo44.htm - "Observations are Always Ordinal; Measurements, however, Must be Interval"
marlon:
Mike,
Thank you for your excellent clarification.
The only thing I am not sure at the moment is the issue of the additional "empty" category ('2') that you are suggesting to include in the model. I mean the following operation:
old category--> new category
-.5 -->0
0 -->1
1 -->3
and one more category 2 not observed in the data and treated as a accidental zero (not structural zero). [STKEEP=yes]
Does this all mean that if my original scoring key was: -.25, 0, 1, I should use the following recoding in my Partial Credit Model:
-.25-->0
0 -->1
1 -->5
and three more "empty" categories 2 and 3 4 treated as existing but accidentaly not observed categories. [STKEEP=yes].
Best,
Marlon
Mike.Linacre:
Marlon: Yes. It appears that, in the original scoring, the testing agency conceptualized +0.5 to be an unobserved but substantial level. This is different from using scoring such as 10,20,30,40,50 where it is clear that 11 is not a substantial level. The substantial levels are 1,2,3,4,5.
So, yes,
-.25-->0
0 -->1
1 -->5
is correct. Otherwise we cannot understand original total raw scores which can be numbers like -0.5, 1.75, 3, 4.25. We can only understand these if we conceptualize substantial levels at every 0.25 for each item between -.25 and 1.
marlon:
Mike,
Thank you for your confirmation. I followed your suggesstion and adopted the coding ssystem as 0,1,2,3 and STKEEP=yes.
BUT there are problems with this empty category 2. The probability curve for this artificial category is always flat and what is more disappointing in most items the transition threshold 1-3 is reversed with 0-3 threshold.
So, I do not know if I should keep analyzing my dataset this way.
Thanks,
Marlon
Mike.Linacre:
Marlon: your results are expected. Since category 2 in not observed, its probability is always zero, and its thresholds will be reversed and infinite.
Disordered thresholds are often observed with idiosyncratic scoring schemes. The test constructors are trying to squeeze more information out of a natural correct/wrong dichotomy. Your findings indicate that their endeavor met with only slight success.
marlon:
Thank you Mike.
It seems the test as a whole is not very good tool.
Most items are very low in discirmanting patterns. Most items have very low both expected and observed PT-serial correaltion. Overall reliability coefficient (even after thowring out the most problematic items) is below .60
Thank you so much for your help! Now more or less I know how to proceed.
Marlon
Mike.Linacre: Marlon, low expected pt-serial correlations indicate that the test is off-target to the examinees. Probably too easy. This may be good or bad, depending on whether the test is intended to be summative (what have they learned?) or formative (what do they need to learn?).
windy October 19th, 2013, 2:07pm:
Hi Dr. Linacre,
I am running an analysis in Facets, version 3.71.3.
My data has missing values that are indicated with ".". I used the command "Missing = ." in my code, but continue to get this error message: Invalid element identifier" "."
Any ideas about where I'm going wrong? Here's my program as an attachment.
Mike.Linacre:
There is a simple explanation for this Windy. Element identifiers cannot be missing in the data, because that makes the Rasch model for those observations undefined.
Usually we have three options:
1) Specify that this element does not apply to this observation by using element number 0:
Example:
24,1,.,1,1,2,2
becomes
24,1,0,1,1,2,2
2) Specify another element number, such as 9 for "Unknown"
Example:
Labels=
....
*
3,gender
1=F
2=M
9=Unknown
*
Data=
....
24,1,9,1,1,2,2
3) Omit the observation from the dataset.
If we have used "9" when the element number is missing, we can do this by commenting out 9 from the Labels=
3,gender
1=F
2=M
; 9=Unknown ; this is commented out, so observations with 9 for facet 3 will be ignored
*
aurora11rose October 18th, 2013, 8:41am:
Dear Mike,
I know that Rasch Analysis is often used for surveys (rating scale). Is it applicable for an oral test for ESL learners though. The scores awarded will be dichotomous with 1 for a correct answer and 0 for a wrong answer. If Rasch Analysis is applicable for an oral test, I would like to use it run internal consistency.
1. May I know what else should I report apart from Infit MNSQ, Outfit MNSQ, ZSTD, Person and Item Separation Index and Crobach's Alpha?
Thank you, Mike!
Mike.Linacre:
Aurora11rose, Rasch is certainly applicable to oral tests. Dorry Kenyon has done a lot of work in this area.
Usually substantive validity issues are more important than statistical issues.
Construct validity: is the test measuring how we intend it to measure? Get experts to order the questions/tasks/prompts/items in order of difficulty (without telling them about the analysis). Then compare this order with the order reported by the Rasch analysis. If they agree, then you have construct validity. If they disagree in a major way, the validity of the test is threatened, irrespective of the statistics. It is not measuring how you intend it to measure.
Predictive validity: order the examinees by ability based on whatever information you have about them apart from the oral test. Compare this ordering with the oral test. If the correlation is high, then you have predictive validity. If not, then the test is not discriminating between high and low performers in a meaningful way. Again the validity of the test is threatened.
If the oral test has construct validity and and predictive validity, then the statistical indicators indicate how much precision the test has. This is usually dominated by the number of items. The more items, the more precise the measurement of the learners.
If the item separation is low, then this indicates that the sample size of learners is too small.
Amity1234 October 17th, 2013, 10:17am: I have a survey instrument that I used Rasch to develop/refine. I want to do a subsequent study where I use the Rasch measures (rather than raw score means) within hierarchical regression analyses. In order to do so, I need a measure for each item/person combination (e.g., a measure for person 1 on item 1, person 2 on item 1, person 3 on item 1, etc.). To find this, I think I need to go to "Output Files" and then click on "Observation File XFILE" and use the "Predicted Person Measure" value to then run the analyses with. Is this correct? Thanks in advance for any insight you can provide!
Mike.Linacre: Yes, Amity1234. Everyone who had the same response to item 1 will have the same "predicted person measure" based on that response to item 1. Those predicted person measures have huge imprecision (big standard errors) because they are based on only one observation.
Amity1234:
Thanks for the helpful response...I appreciate it!
Amity
MariaM October 15th, 2013, 7:02pm:
Dear Dr. Linacre,
I have 34 examinees who have written on Prompt A and 34 examinees who have written on Prompt B. I wish to compare the two prompts in terms of difficulty. Approximately how many additional examinees do I need to recruit to write on both prompts in order to have connectivity? Is 10 enough? Is there a rule of thumb about this? Thanks so much!
MariaM
Mike.Linacre:
MariaM: this depends on how certain you need to be about the relationship between the two prompts. But, assuming the prompts are scored holistically with a multi-category rating scale, or holistically with a set of items, then 3 examinees would be the absolute minimum and 30 examinees would be more than enough.
Prompts are usually designed to be equivalent in difficulty, so we don't expect a big difference. If your prompts are scored holistically with a long rating scale, or analytically with a set of items, then 10 common examinees are probably equivalent to 30 examinees on a dichotomously scored item. This is the recommended number in https://www.rasch.org/rmt/rmt74m.htm
The absolute minimum would be 3 examinees. A practical minimum would be 5 examinees. Above 5 examinees we would not expect to see much alteration in the equating constant, but, just in case on of those 5 is a maverick, 10 examinees is a good working number.
MariaM: Thank you so much!
rag October 13th, 2013, 3:53pm:
Hello,
I'm trying to replicate my Winsteps estimates in R using the eRm package (see: http://erm.r-forge.r-project.org/). From what I can tell, the biggest difference between eRm and Winsteps is that eRm uses CML, while Winsteps uses JML.
My sample data have 8 items and 651 respondents. Here are the item measures for each program.
Item Winsteps eRm
LDAC548 0.15 0.15
LDAC556 -0.3 -0.25
LDAC561 0.32 0.29
LDAC562 -0.51 -0.44
LDAC584 -0.74 -0.64
LDAC592 1.09 0.94
LDAC724 -1.37 -1.21
LDAC725 1.37 1.17
Before I dig further into the models and try to replicate other estimates from Winsteps (such as fit stats), I want to get feedback on whether the two estimates are reasonably close and that whether it is common to see this degree of difference between the two estimation algorithms.
Thanks
Robin
Mike.Linacre: Rag, the relationship between JMLE and CMLE estimates is roughly a line of slope L/(L-1) where L = number of items. The mean difference between the estimates is arbitrary. For your estimates, expected relationship = 8/7 = 1.14. Actual relationship = 1.15 and a plot shows they are collinear. All is as expected :-)
rag:
Thanks Mike,
That's great news. Next question, I'm trying to replicate the person-separation reliability using eRm. I'm taking your formula in the Winsteps help file:
observed variance=var(person parameters)
model error variance=sum(person_se^2)
model reliability=(observed var-model var)/observed var
The issue I'm running into is that eRm doesn't seem to estimate standard errors for 0 and full responses. It uses a spline interpolation to get their measures, but returns an NA for the se. I got all screwed up when I tried to calculate reliability until I realized I was missing a bunch of observations. Is this a result of using CML vs JML, or does Winsteps get around this in a different way? I know this is related to someone else's software package, so if you don't really have any insight I can understand that.
Thanks
Mike.Linacre:
Robin, in Table 3.1, Winsteps reports summary statistics with and without extreme scores.
This is not a CML vs. JML issue. If eRm reports estimates for extreme scores using some method, then that method can also be used to compute standard errors. The authors of eRm have probably not got round to implementing that feature. Winsteps and its predecessors are now 30 years old, so there has been plenty of time to fill in the gaps in the computations.
OrenC October 10th, 2013, 7:14pm:
Good day,
I have a Rasch paper being reviewed for publication and one reviewer asked for response curves. Is there a way to produce these curves with my items numbered over a straight line versus each curve being made by the item number. There are nice lines in the help file titled "Disordered rating or partial credit structures (Categories or Rasch-Andrich thresholds)" but I am not sure how to produce the same curves in Winsteps.
Thanks,
Oren
Mike.Linacre: Oren, what is the title of the Help topic with the "nice lines"?
OrenC:
I found the graph at help file titled Disordered Rating Categories :Winsteps help available. At the webpage below.
Thanks,
Oren
https://www.winsteps.com/winman/disorders.png
Mike.Linacre:
Oren: that Graph is from the
Graphs menu
Probability Curves
Copy Plot to Clipboard
then I pasted into my Graphics editor (e.g., http://www.getpaint.net/)
and added the text and arrows
then saved a .png file
OrenC:
Thanks!
I'll make my nice chart now :)
OrenC:
Good day (or evening),
I have made my nice probability curves. I have 9 items in the scale. It looks like all the items have the same ordering (or disordering in this case).
Am I missing something in creating my graph? Based on the other statistics I do not think they should all look the same.
Thank you from the currently lost Oren.
Mike.Linacre:
Oren, you have specified the "Rating Scale" model where all items share the same rating scale structure, so all the sets of probability curves look the same.
You probably want the "Partial Credit" model where each item defines its own rating scale. In Winsteps, add command ISGROUPS=0 to your control file.
OrenC October 14th, 2013, 1:15am:
Good day Mike (or other respondents).
In a response to another "babymember" you have mentioned the following:
"Disordered thresholds are only a problem if you intend to make category-level inferences on individual items. For instance, if you intend to say "Scoring a 3 on item 4 means that ....". If scores on items are only indicative of a general performance level then disordered thresholds are no problem. For instance, in scoring Olympic Diving, there can be disordered thresholds."
Is there a good reference for this statement? I have searched the forum, Google, and winsteps web side, and did not find one (which does not mean it does not exist).
Thanks for all your help to all of us learners,
Oren
Mike.Linacre:
Oren, you will find references both ways: "disordered thresholds are always are big problem" vs. "disordered thresholds may not be a problem at all". The most authoritative Rasch expert, David Andrich, asserts that they are a big problem. My own perspective is the other way, for instance,
Linacre J.M. (2010) Transitional categories and usefully disordered thresholds. Online Educational Research Journal. March. 1-10. www.oerj.org/View?action=viewPaper&paper=2
albert October 11th, 2013, 12:23pm:
Hi, Mike:
If I choose JMLE as the case estimation, and I could get a score eqv table from case mle. Is there a way to convert the MLE score eqv to WLE score eqv table? or I have to do WLE as the case estimation.
THanks,
Mike.Linacre:
Albert, the current version of Winsteps gives WLE estimates in the PFILE=.
If you need a WLE estimate for every possible raw score, and they are not present in your data file, then add dummy person records to the data file, one for each raw score, and weight them 0. They will be reported in the Person Measure Tables (entry order is best) and the PFILE=, but will not influence the estimates of the other persons or items.
Example: There are 10 dichotomous items. So we need to add 11 dummy person records. Let's make them the first 11 persons in the data file:
In the Winsteps control file:
(your control instructions go here)
PWEIGHT=*
1-11 0
*
&END
...
END LABELS
0000000000 (align these with the observations in your data)
1000000000
1100000000
1110000000
1111000000
1111100000
1111110000
1111111000
1111111100
1111111110
1111111111
(original data goes here)
albert:
Hi, Mike:
My understanding for score eqv table is that it is independent with the data, and once given the item parameters the score eqv table will be calculated. Is this how it is implemented in winsteps?
ALbert
Mike.Linacre: Yes, Albert. Since the extra persons are given a weight of zero, they do not influence the item estimates. The estimates of the abilities of the extra persons is based on the item estimates computed from everyone else.
linda October 11th, 2013, 7:35am:
Hello,
So I'm quite a newbie to the Rasch Model, so my questions might seem a bit basic. Thanks in advance :)
The reason why an item or person would get excluded during an anlysis fit is either they are misfitting or they have a zero or full response. Are there any other reasons?
In the latter case, when they have a zero or full response (i.e. a question that no one manages to answer correctly answers or vice versa, and similiarily for a person), what do I do? How can I eventually get values for the removed person's ability or item's difficulty parameter?
I read somewhere that you can extrapolate, however I'm not sure how I should go about that...
Mike.Linacre:
Linda, modern software does the extreme-score extrapolation for you, and does not exclude persons with extreme scores from reporting. There is usually nothing for you to do. If you want to extrapolate the measures for extreme scores yourself, there are numerous reasonable methods, see https://www.rasch.org/rmt/rmt122h.htm
Other reasons: Rasch is robust against missing data, but sometimes persons are excluded by analysts because they have too few valid responses. For instance, persons who leave a testing session after only responding to two or three items.
Michelle October 10th, 2013, 9:46pm:
Hi there,
I have a construct for the overall purchase intent across various foods in an experiment, and a mean logit of 0 isn't useful for comparing the Rasch measure against the original score (based on Likert scales).
I've calculated the USCALE and UIMEAN values I need to recalibrate to a 0-100 scale, which is more meaningful given the construct. I keep copies of all my Winsteps files, and I was wondering how I input the correct values into the Winsteps file so it is retained permanently in the analysis. I realise I can use the Specification box but I assume that won't amend my Winsteps file.
I have copied in the start of my analysis file below. I need to set USCALE=11.53 and UIMEAN=50.62, based on my logit extreme values of -4.39 and +4.28.
How do I amend my analysis file to incorporate the rescaling?
Thanks in advance
&INST
Title= "RaschPurInt2.RData"
; R file created or last modified: 11/10/2013 10:00:46 a.m.
; R Cases processed = 1127
; R Variables processed = 14
ITEM1 = 1 ; Starting column of item responses
NI = 8 ; Number of items
NAME1 = 10 ; Starting column for person label in data record
NAMLEN = 15 ; Length of person label
XWIDE = 1 ; Matches the widest data value observed
; GROUPS = 0 ; Partial Credit model: in case items have different rating scales
CODES = 012345 ; matches the data
TOTALSCORE = Yes ; Include extreme responses in reported scores
; Person Label variables: columns in label: columns in line
@ID = 1E4 ; $C10W4
@QAGE = 6E6 ; $C15W1
@QSEX = 8E8 ; $C17W1
@COUNTRY = 10E10 ; $C19W1
@Dependants = 12E12 ; $C21W1
@ClaimPresence = 14E14 ; $C23W1
&END ; Item labels follow: columns in label
Q1A ; Item 1 : 1-1
Q1B ; Item 2 : 2-2
Q2A ; Item 3 : 3-3
Q2B ; Item 4 : 4-4
Q3A ; Item 5 : 5-5
Q3B ; Item 6 : 6-6
Q4A ; Item 7 : 7-7
Q4B ; Item 8 : 8-8
END NAMES
Mike.Linacre:
Michelle, use a text editor, such as NotePad,
and place these lines:
USCALE=11.53
UIMEAN=50.62
anywhere between &INST and &END
for instance:
&INST
USCALE=11.53
UIMEAN=50.62
Title= "RaschPurInt2.RData"
Winsteps reads in everything before &END and then acts on the instructions, so the ordering of the instructions does not matter :-)
marjorie October 10th, 2013, 12:43am:
Hi,
We were recommended to take a introduction course on Rasch analysis with M Linacre. We were told it could be available online. We can't find the information, is it still available with him as an instructor? If so, how can we register?
Thank you.
Mike.Linacre: Marjorie, that Rasch Course is now conducted by Everett Smith. Please see http://www.statistics.com/courses/social-science/rasch1
marjorie: I will consult the web site for information. Thank you.
Michelle October 6th, 2013, 8:05am:
Hi all,
I have some strange behaviour happening today with the folder where I am about to do some further Rasch analysis on a couple of scales that I last analysed around 18 months ago. I have upgraded my Winsteps so I have the latest version and I have Windows 7 Ultimate 64-bit.
I used one of the text files I had created for the analysis 18 months ago as the trial to make sure that Winsteps installed fine, for the last two installs.
I've just been trying to remember what I'm doing with the data, and I thought I would have a peek in the folder. But I couldn't open it - double-clicking the folder and right-clicking, then choosing Open didn't work. I checked the Properties, and could see file content. Doing a copy-paste of the folder created a copy that I could open, with files that look fine. There was a copy of the default file inside that folder so obviously Winsteps could still work with the folder, but not Windows 7.
What seems to have fixed the problem was right-clicking the buggy folder and choosing "Open file location". When I went back in, and then double-clicked on the misbehaving folder, I could open it.
I just redid my steps in Winsteps and then shut Winsteps down again and I cannot replicate the problem. There is no difference in icon image for the folder, nor could I locate any issue when I checked the Properties when the folder was misbehaving.
/sigh
???
cheers
Michelle
Mike.Linacre:
Michelle, regrettably this is definitely a Windows problem, not a Winsteps problem. Winsteps does not change file permissions. Winsteps does "plain vanilla" file access through Windows.
I have run into similar problems when automatic Windows file indexing or automatic file backup is accessing a file at the same time that I want to access it.
Michelle:
Hi Mike,
Thanks for replying. I have had similar issues in Windows when a program shutdown has created a lockfile, but that has tended to be a file issue and not a folder issue. At least I've found the "fix", if anyone else has this problem.
Mike.Linacre: Yes, thank you, Michelle.
uve October 5th, 2013, 11:03pm:
Mike,
In our elementary English program we administer 6 unit exams for grades 1-6 during the year, each having 50 items. This year, one staff member decided he wanted to develop base measures for grades 3-6 and so took 10 to 15 items from each unit exam and built diagnostic tests of 75 items for each of those grades and administered them within the first few weeks of this school year. His thought is that at the end of the year he will give the identical diagnostic again and measure if students have performed better or not as a measure of growth. Most students will take all 6 units including the diagnostic. I can keep track of all common persons and common items. Our expectations are that students will do much better by the end of the year after instruction has been completed on all topics, but we want to know just how much better. I believe this comparison is very straightforward and so comparing performance on the pre and post diagnostic will be rather easy to do.
However, the question has come up about tracking growth during the year. I have two questions:
1) Can we measure the improvements being made on the unit exams as compared to the diagnostic?
2) Can we measure the improvements being made between unit exams?
As I see it, the first scenario has two possibilities: The first is to examine the stability of the common items between the diagnostic and the unit exams. If they meet a certain criterion I have, then I can anchor the diagnostic common item difficulties and calibrate the remaining 35-40 unique unit items then compare average person measures of the entire 50 item unit test and the 75 item diagnostic. The second would be to develop person measures based only on the diagnostic items common to the unit being compared, then anchor the items from the diagnostic calibration and produce person measures based only on the performance of the common items on the unit test compared to the 10-15 items on the diagnostic. Would either two of these be valid for the first scenario or am I completely off base here?
For the second scenario, there are no common items between units, but most of the persons will be the same. If the topic for unit 2 is designed to be more difficult than unit 1 and common respondents have identical average person measures between the two, then the averages will tell us no change or improvement has occurred when in fact the same average person measure on a harder unit would actually indicate growth. In the second scenario, how could I use common person measures on units of differing topics and difficulty to indicate students are improving or struggling compared to the prior unit?
Thanks again in advance for all your guidance and help.
Mike.Linacre:
Uve, students have certainly been tracked across years using Rasch methodology and linked tests. Portland, Oregon, Public Schools were the first to do this on a large scale. This expertise is now part of NWEA - http://www.nwea.org/
If this is planned in advance, items can be spiraled across test sessions so that no child sees the same item twice, but a network of linked tests is formed.
Where linking is not available, then "virtual equating" is usually good enough for practical purposes: https://www.rasch.org/rmt/rmt193a.htm
For the more technical aspects of your questions, and if you have an available budget, NWEA are the folks to talk to.
iyliajamil September 30th, 2013, 1:40am:
hi mr. linacre,
if we want to test unidimentionality of of an item bank.
what is the minimum value of Unexplained var explained by 1st factor value?
is there any characteristic that we should look in to?
thank you.
Mike.Linacre:
iyliajamil,
upper and lower limits for "unexplained variance" for an item bank are difficult (impossible?) to estimate because they depend on the person sample distribution: see https://www.rasch.org/rmt/rmt221j.htm
We would probably need to investigate the size (eigenvalue) of the first component in the residuals. This indicates the presence of a secondary dimension in the items: https://www.rasch.org/rmt/rmt191h.htm
The current versions of Winsteps (and probably RUMM) compute the correlation between person measures on different components in the data - Winsteps Table 23.0. These can be used for identifying whether the components are "dimensions" (like "height" and "weight") or strands (like "addition" and "subtraction").
iyliajamil:
hi, mr linacre,
i have look through the link that you ginve me, but did not really get the solution.
Below is my result:
Table of STANDARDIZED RESIDUAL variance (in Eigenvalue units)
Empirical Modeled
Total variance in observations = 11394.2 100.0% 100.0%
Variance explained by measures = 10315.2 90.5% 91.0%
Unexplained variance (total) = 1079.0 9.5% 9.0%
Unexpl var explained by 1st factor = 7.4 .1%
what can you explain from this result?
my total item are 1080 and total person 1464
is there any cut point value of eganval. unexp var explain by 1ft factor
such as below 2? to determine that the test set is consider fit the unidimentionality characteristic.
do item size effect the eganval unexpl by 1st factor?
what about the %val. variance exp by measure? is 91% ok?
Mike.Linacre:
iyliajamil, 91% explained variance is huge. Usually the explained variance is less than 40%. 91% is probably artificial, and is caused by Winsteps imputing the missing data. So, please do NOT act on the 91%.
The biggest secondary dimension only has the strength of 7 items in an item bank of 1079 items. This is very small. https://www.rasch.org/rmt/rmt233f.htm tells us that the expected value for "7" is 4. So your data are close to perfectly unidimensional from a Rasch perspective.
iyliajamil:
So what am i to do with the 91% explain variance?
should i not report it?
Mike.Linacre:
iyliajamil, without knowing the exact details of your analysis, you can probably say:
"91% of the variance in these data is explained by the Rasch model, assuming that unobserved data exactly matches Rasch model predictions."
albert October 3rd, 2013, 4:42am:
Hi, Mike:
Does Winsteps support Pairwise maximum likelihood estimation? I am a bit confused with key word "Paired=" in the manual?
Mike.Linacre:
Albert, the "Paired=" in the Winsteps data refers to pairwise data, not Pairwise Maximum Likelihood Estimation.
Pairwise data: Each case (person or item) focuses on two of the contestants (items or persons). One contestant wins = 1, the other contestant loses = 0. All the other contestants are missing data for this case. There is an example using a Chess Competition at https://www.winsteps.com/winman/index.htm?example13.htm
Pairwise Maximum Likelihood Estimation (PMLE): maximizes the likelihood of the complete or incomplete data when the data are expressed as 2 x 2 matrices.
These are different things, but, you can reformat a standard dichotomous rectangular matrix (person and items) into a pairwise data matrix. Each row is an observation. The columns are persons and items. The relevant person wins or loses. The relevant item loses or wins. Then Paired=Yes, and you are effectively doing PMLE.
albert:
Thanks, Mike.
I understand it like this, if I want to use PMLE in Winsteps, as it was not directly implemented in Winsteps, and i can work around by arrange the pairwise data first, and then set Paried=Yes, then winsteps will give the PMLE estimation. If using RUMM, the program will arrange the data in a pairwise format and produce the PMLE.
Do I understand correctly?
Thanks,
Mike.Linacre: Yes, Albert, RUMM analyses the data in a pairwise manner. See http://conservancy.umn.edu/bitstream/118398/1/v19n4p369.pdf
uve September 10th, 2013, 6:12pm:
Mike,
As I understand it, when setting non-uniform DIF to something like MA2, Winsteps appears to simply divide the observations into two equal groups. We could call the upper group the high performing the the other the lower performing. However, I might want to define a specific cut point (usually proficient) which might not have equal numbers of observations above and below. Is there a way I can tell Winsteps to use a specific logit point for MA2, or even more like MA3, etc.?
Mike.Linacre:
Yes, Uve, the documentation of MA2 is vague. The split is actually by ability (for DIF) or by difficulty (for DPF), not by group size. The MA2 strata are equally long divisions of the reported range of the statistic. In general,
Stratum number for this value = Max(1+ Number of strata * (Current value - Lowest reported value)/(Highest reported value - Lowest reported value), Number of strata)
For specific logit cut-points, an extra column would need to be placed in the person label containing a different code for each ability level. This column would then become part of the DIF= instruction.
The non-uniform DIF ICCs on the Graphs menu are usually more instructive than MA3 because we can see at exactly what levels the DIF impacts.
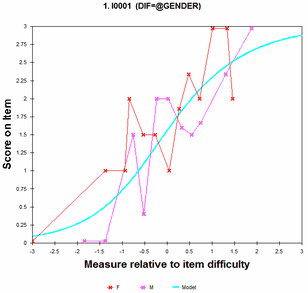
uve:
Mike,
In their paper, "Distractors with Information in Multiple Choce Items: A rationale Based on the Rasch Model" Andrich and Styles claim that MC items can be converted into partially correct. I'm simplifying but the process starts by eliminating any response probabilities of .20 or lower and recoding them as missing. Then, the data are analyzed again with respondents grouped into 10 class intervals.
"Then any distractor of an item which had a greater than chance level response in the middel class interval, was deemed a candidate for possible rescoring."
The empirical interval was adjusted on the first graph until only 10 groups appeared, at about 1.10. The DIF chart was left at the default of .47.
Here is where I'm getting stuck. Should I be adjusting the empirical interval until only 10 groups appear as on the left chart attached, or should I be performing a 10 class non-uniform grouping as with the attached chart on the right?
Mike.Linacre:
Uve, the Andrich and Styles technique sounds like a "what-works-best-for-us-with-these-data" approach. So, you would do the same. Choose the approach that works best for you.
In general the number of groups and their stratification depend on the size and distribution of the sample. We would certainly want each stratification to contain at least 30 persons. When available, please show the SEs on the Graphs so that you can see that deviations are not model-predicted randomness.
acdwyer77 September 26th, 2013, 3:33pm:
I'm analyzing a test that consists of several 4-option multiple choice (MC) items (dichotomously scored) and several partial credit items (polytomously scored). The PC items each have their own response structures.
Suppose, for example, I have 7 items in total, with 4 MC items and 3 PC items. The 3 PC items have maximum scores of 3, 3, and 4, respectively. Below is the Winsteps control file I think I would use to calibrate these items (although IÆm not sure if the IVALUE3 and IVALUE4 lines are necessary or if the IREFER line is exactly right):
&INST
Title= "Test.csv"
; Excel file created or last modified: 9/24/2013 4:52:30 PM
; Test
; Excel Cases processed = 3
; Excel Variables processed = 8
ITEM1 = 1 ; Starting column of item responses
NI = 7 ; Number of items
NAME1 = 9 ; Starting column for person label in data record
NAMLEN = 6 ; Length of person label
XWIDE = 1 ; Matches the widest data value observed
ISGROUPS = MMMM000 ; M for MC items, 0 for PC items
IREFER = ACDB334;
CODES = ABDC01234; matches the data
IVALUEA=100000000 ; MC item - A IS CORRECT
IVALUEB=010000000 ; MC item - B IS CORRECT
IVALUEC=001000000 ; MC item - C IS CORRECT
IVALUED=000100000 ; MC item - D IS CORRECT
IVALUE3=00000123* ; PC item - 3 max score
IVALUE4=000001234 ; PC item - 4 max score
TOTALSCORE = Yes ; Include extreme responses in reported scores
; Person Label variables: columns in label: columns in line
@CandID = 1E5 ; $C9W5
&END ; Item labels follow: columns in label
I1 ; Item 1 : 1-1
I2 ; Item 2 : 2-2
I3 ; Item 3 : 3-3
I4 ; Item 4 : 4-4
I5 ; Item 5 : 5-5
I6 ; Item 6 : 6-6
I7 ; Item 7 : 7-7
END NAMES
ABAD214 00001
DCDB023 00002
ACDB334 00003
So my first question is if there are any errors in the code above. My second question is how would I go about getting person ability measures for specific subscores of items? For example, suppose I'd like to get 3 subscores for items 1-3, 4-5, and 6-7. I suppose I could calibrate the items in one run, then in subsequent runs I could fix the items at their calibrated values and mess with the item weighting to get each of the subscore ability measures (e.g., weighting items 1-3 as 1 and the remaining items as 0 to get subscore measures for items 1-3). Any ideas or suggestions? IÆd love to be able to accomplish this in one run, if possible. Thanks!
Mike.Linacre:
That control file looks good to me, acdwyer77.
Subscores: this depends on how much detail you want. Your approach does work:
1) Analyze all the data: IFILE=if.txt SFILE=sf.txt PFILE=all.xls
2) Analysis for items 1-3: IAFILE=if.txt SAFILE=sf.txt IDELETE=+1-3 PFILE=13.xls
3) Analysis for items 4-5: IAFILE=if.txt SAFILE=sf.txt IDELETE=+4-5 PFILE=45.xls
4) Analysis for items 6-7: IAFILE=if.txt SAFILE=sf.txt IDELETE=+6-7 PFILE=67.xls
5) Copy-and-paste between the Excel files to construct the combined table that you want.
or, if you want to see numbers quickly:
(your control file here)
DPF=1 ; differential person functioning based on column 1 of the item labels
TFILE=*
31 ; DPF report
*
&END ; Item labels follow: columns in label
AI1 ; Item 1 : 1-1
AI2 ; Item 2 : 2-2
AI3 ; Item 3 : 3-3
BI4 ; Item 4 : 4-4
BI5 ; Item 5 : 5-5
BI6 ; Item 6 : 6-6
BI7 ; Item 7 : 7-7
END NAMES
(your data here)
acdwyer77: Thanks, Mike. I will give it a go and let you know if I have any problems. I really appreciate your help!
OrenC September 27th, 2013, 2:21pm:
Good Day,
I would like to confirm an answer to a question I am planning on giving someone.
The question I got was:
"Based on several readings, an assumption of the Rasch is that it is sample independent. If we know that a group of patients who are completing the survey we have created in English do not know English, how can the tool be valid for that group (the tool fit with the Rasch model)?"
My answer is:
"This is a good question (need to be polite with my answer :)). If we have the information of who of those who completed our measure does not speak English well we can do a DIF analysis to evaluate if they performed differently than the rest of the group on our measure. If they did, we can translate the measure to their language, analyse the revised measure with Rasch and see how the scale/people perform then. The neat thing of Rasch, is that now we can put both groups (English speakers and non-speakers) on the same ruler and see how the items/people behave. I do not think that a Rasch scale being sample indep means it does not need to be adjusted for different populations."
Does my answer make sense? I think it does... to me...
Thanks,
Oren
Mike.Linacre:
Yes, that is right, OrenC.
Rasch is designed to be "sample independent within the same population". We usually have to discover the extent of the population empirically. Are ESL and native-speakers in the same population or not? For arithmetic tests, probably yes. For language tests, probably no.
Then we raise a different question: which population is the decisive one? For the TOEFL, obviously the ESL population. For a medical situation, obviously the relevant patient group. We can then apply the "ruler" developed for the relevant population to everyone in order to discover what the relationship is between our population and everyone else. For instance, with a DIF study as you remark.
Newbie_2013 September 24th, 2013, 1:26am:
Hello:
I have heard that the Rasch model has unique qualities that make it desirable for measurement (e.g., produces interval-level data). How does the Rasch model produce interval-level data yet a 2-PL which allows varying discriminations does not? Any explanation, mathematical or conceptual, would be great. Is there anything else aside from interval-level data that makes the Rasch model preferred? I have read many sources online but I still am confused.
Thanks!
Eric
Mike.Linacre:
Eric: the aim of 2-PL (and IRT in general, except Rasch) is to describe the dataset parsimoniously. The aim of Rasch is to construct interval (linear, additive) measurement.
The origin of 2-PL is in the "normal ogive" model of L.L. Thurstone. Frederic Lord extended that model:
(1) he made it easier to estimate by substituting the logistic ogive for the cumulative normal ogive. They are a reasonably close match.
(2) adding additional parameters, such as discrimination (2-PL) and lower asymptote = guessability (3-PL)
The origin of Rasch is in the "Poisson counts" model of Siméon Poisson. Georg Rasch chose that model and reformatted it for dichotomous observations, because it supports separability of parameters and does not require parameter distributions to be specified or assumed.
We can start from the requirement that our target model produce interval-level estimates from probabilistic dichotomous data. There are many different ways of deducing the necessary and sufficient model from that requirement. All paths lead to the Rasch model. For instance, Rasch model from objectivity: https://www.rasch.org/rmt/rmt11a.htm
Eric, for a general discussion of PL models vs. Rasch, see: "IRT in the 1990s: Which model works best?" https://www.rasch.org/rmt/rmt61a.htm
Newbie_2013:
Thank you for the email, and links. To be clear, the reason the final equation in the first link produces interval level data is because the right side of the equation only includes a subtraction between person ability and item difficulty? Moreover, it is on the logit scale which has no boundary (- inf to + inf) which is desiresble, I think. In the same vein, when discrimination is allowed to vary across items, it is multiplied on the right side of the equation and therefore one loses the interval level property. Is that right?
Thanks,
Eric
Mike.Linacre: Eric: Yes, "interval" means the same as "additive": "one more unit is the same amount extra regardless of how much there already is." When we multiply parameters, this additive property is lost.
Newbie_2013:
Very clear. Thank you. I recently read somewhere that the Rasch model fits within the theory of "conjoint measurement," whereby both "single cancellation" and "double cancellation" are achieved. I am struggling with these three terms, and how the predicted probabilities from a Rasch model can demonstrate this.
If you have the time, would you mind explaining what these terms mean and whether or not you agree that the Rasch model falls within the theory of conjoint measurement?
Thanks.
Eric
Mike.Linacre:
Eric, the theory of "conjoint measurement" focuses on the paper by Luce and Tukey (1964) - there is a thorough description at http://en.wikipedia.org/wiki/Theory_of_conjoint_measurement which includes single- and double-cancellation.
Luce and Tukey are discussing conjoint measurement without specifying how additive measures are to be constructed. When we specify an additive statistical model, such as a Rasch dichotomous model, the scalogram of the probabilities must exhibit single and double cancellation because of the strong ordering of the probabilities.
For much more, see George Karabatsos - http://tigger.uic.edu/~georgek/HomePage/Karabatsos.pdf
Newbie_2013:
Hello:
I have read the documentation on single and double cancellation, and I think I understand the very basic principles of the theory and how it applies to Rasch modeling. What I would like to know is why Dr. Linacre stated "...strong ordering of the probabilities" in his last post. Exact what is meant by "strong..."?
Thank you!
Eric
Mike.Linacre: Thank you for your comment, Eric. My apologies, I was not using "strong" in its axiomatic sense. if we allow two or more estimated Rasch measures to be the same, then we have weak ordering with ties, and cancellation does not apply. This has caused some logicians to say that Rasch does not implement axiomatic conjoint measurement. Ties are not allowed in single- and double-cancellation. However, if we have a set of estimated Rasch measures in which no two measures are the same, then then we have a Guttman matrix of probabilities and single- and double-cancellation do apply,
annatopczewski September 25th, 2013, 6:20pm:
Hi,
I have general questions about the application of pweights during a winsteps calibration.
1) Is the JMLE method appropriate to use with pweights, specifically will the use of pweights lead to biased estimates?
2) Are there guidelines in the use of pweights? How much weighting is too much? 2:1? 20:1? 200:1?
3) If pweights have very different relative magnitudes (100:1) , is it better (less bias) to use unweighted item parameter estimates or use the weighted item parameter estimates?
I know there are probably no hard rules to these questions but any sort of "guidelines" or references would be appreciated.
Thanks!
Mike.Linacre:
Thank you for your questions, atop.
pweight (person weighting) is always done for a reason.
The procedure is:
(1) analyze the data with no weighting.
Verify that all is correct.
(2) apply the pweights.
Pweight always biases the estimates and the fit statistics. So we ignore the fit statistics at this stage. The bias in the estimates is deliberate.
Example: We have a sample to which we want to apply census-weighting, for example, http://www.census.gov/cps/methodology/weighting.html
(1) We analyze the data we have collected with no weighting. We verify that the dataset is satisfactory: construct validity, reliability, etc.
(2) We apply the census weights using pweight=
The analysis now produces the sub-total findings that we want (gender, ethnicity, etc.) using psubtotal=
In (2) we rescale all the pweight= so that the reported person reliability from (2) is the same as the reported reliability from (1). Then we do not mislead ourselves that we have measured the sample better than we really have: https://www.winsteps.com/winman/index.htm?weighting.htm
hard September 22nd, 2013, 12:42pm:
hi all, i'm a new rasch student.
i want to know how to simulated Facets data with 3 facets and its raw ability.
sorry,my English is not well.
Thanks.
Mike.Linacre:
Friend, if you are using Facets or Minifac,
"Output Files" menu, "Simulated Data File"
https://www.winsteps.com/facetman/index.htm?simulateddata.htm
hard:
Thank you ,Mike
your explanation is so clear.
now, i had other problem.
if my items Separation>2 and Reliability>0.9, there is a outfit>2 in my items.
however, i will delete the item and restart new dara or i have another way to resolve the unsual item.
All the best.
i am used to analyzing the data in Facets.
Mike.Linacre: Hard, if you are simulating data, then the large outfit is probably the result of the randomness predicted by the Rasch model. Please do not force your data to overfit the Rasch model.
MING:
Hello,Mike
What's the overfit meaning?
Thanks a lot.
Mike.Linacre: Ming, "overfit" is when the fit of the data to the model (or the model to the data) is too good. See, for example, https://www.rasch.org/rmt/rmt222b.htm
MING: Thanks for your explanation!
Nettosky September 23rd, 2013, 10:09am:
Hello, i have a question: i can see anywhere in the literature that a PSI of .85 and above is required for discrimination at the individual level, while .70 is sufficient for group level, although i can't find a reference for that. In my analysis i reached .84. How do i interpret this value? Is it sufficient for individual use? Is there a reference for the interpretation of the PSI?
Thanks in advance for your help
Mike.Linacre:
Nettosky, those interpretations of Reliability (PSI) are new to me as general statements.
Let's assume that the person sample matches the person population distribution.
Then, if we need to split the population into high and low performers, we need a PSI of at least 0.7. If we need to split the population into high, medium and low performers, we need a PSI of at least 0.8 - https://www.rasch.org/rmt/rmt63i.htm
If we are comparing group means, then the higher the PSI, the lower the group size in order to detect statistically significant differences.
Nettosky:
Thanks a lot prof. Linacre,
this is just an example (although you can find this thing written in many other papers concerning Rasch Analysis), and the reference they provide is the same you have posted: "The Person separation index (PSI) reflects the extent to which items can distinguish between distinct levels of functioning (where 0.7 is considered a minimal value for research use; 0.85 for clinical use) [18]. Where the distribution is normal, the PSI is equivalent to Cronbach's alpha" (from http://www.hqlo.com/content/9/1/82#B18).
The article by Fisher, however, does not make any assumption on a PSI threshold for clinical use and i suppose that both 0.80 and 0.85 can split the population into 3 (correct me if i am wrong). Now i will cite that reference and explain it according to the number of discernible strata, i just hope my referees agree.
Mike.Linacre: Nettosky, we don't have to rely on "authorities". The math is straightforward enough. See https://www.rasch.org/rmt/rmt163f.htm "Number of Person or Item Strata: (4*Separation + 1)/3"
Nettosky: Thanks again for your explanation!
LauraA September 17th, 2013, 1:53pm:
Hi,
I have a question regarding disordered thresholds. In the initial analysis I ran I found that one item showed evidence of disordered thresholds, despite having a good overall fit to the model. The disordered threshold was resolved by collapsing adjacent categories, however now the same item is misfitting the model (high fit residual). Is it valid to retain the initial analysis despite the disordered thresholds, as I do not want to remove this particular item from the scale if I can help it?
Thanks in advance,
Laura
Mike.Linacre:
Thank you for your question, Laura.
Disordered thresholds are only a problem if you intend to make category-level inferences on individual items. For instance, if you intend to say "Scoring a 3 on item 4 means that ....". If scores on items are only indicative of a general performance level then disordered thresholds are no problem. For instance, in scoring Olympic Diving, there can be disordered thresholds. This does not matter because the rating scale is intended to give an overall impression, not a precise meaning:
- 10: Excellent
- 8Į - 9Į: Very good
- 7 - 8: Good
- 5 - 6Į: Satisfactory
- 2Į - 4Į: Deficient
- Į - 2: Unsatisfactory
- 0: Completely Failed
LauraA:
Thanks Mike,
Unfortunately each score does give a precise meaning. In this situation is my only option to remove the item that is now mis-fitting after rescoring the disordered threshold?
Also, I would like to compare a 4-item and 7-item scale to see if statistically the 7-item scale is a better fit to the model. Is there anyway to do this? I have compared person rasch scores using a paired samples t-test and found a significant difference between the two scales- is this valid or is there a better method?
Thanks for all your help :)
Mike.Linacre:
LauraA, when you say the item is "now mis-fitting" are you allowing for the fact that you have increased the fit magnification? See https://www.rasch.org/rmt/rmt234h.htm - Also perhaps the original threshold disordering was small. If so, are you sure that it was not due to the expected random component in the data?
"Statistically better"?
1. Precision? Compare the person reliabilities
2. Efficiency? Compare the person reliabilities adjusted by the Spearman-Brown Prophecy Formula
3. Meaning? Compare the (Spearman-Brown?) correlation with an external indicator variable.
LauraA:
Thanks Mike,
By mis-fitting, I mean the fit residual is above +2.5 (2.904), although the overall fit statistics are relatively unaltered.
So the person reliability is the person separation index, so I should compare the two scores with a t-test? For the 4-item scale the PSI is 0.42 for the 7-item it is 0.48. How would I adjust the person reliabilities with the Spearman-Brown Prophecy formula? Apologies for all of the questions!
Thank you very much, I really appreciate all of your help
Mike.Linacre:
Laura,
You wrote: "the fit residual is above +2.5 (2.904)"
Reply: It sounds like that depends on the power of the fit test. How many observations?
You wrote: "compare the two scores with a t-test"
Reply: I don't know how to do a t-test correctly under these conditions. The first step would probably be to normalize both sets of scores. Instead, my choice would probably be a correlation.
You wrote: 4-item scale the PSI is 0.42 for the 7-item it is 0.48.
Reply: So the 7-item test produces more precise measurement, as we expect.
We can predict the expected 7 item reliability from the 4-item reliability using Spearman-Brown Prophecy Formula:
Expected 7-item reliability = 7 * 0.42 / (4*(1-0.42) + 7*0.42) = 0.56
But the observed 7-item reliability is only 0.48, so the 4 item test is more efficient.
LauraA:
Hi Mike,
The sample size is 180, I am using RUMM2020 software which highlights extreme fit residual values +/- 2.5.
Thank you very much for your help regarding the Spearman-Brown Prophecy Formula :)
Mike.Linacre:
LauraA, sample size is 180, fit residuals is 2.9, therefore the mean-square fit is 1.4 - https://www.rasch.org/rmt/rmt171n.htm
We can look at https://www.rasch.org/rmt/rmt83b.htm "Reasonable Mean-Square fit statistics". This reports that the reasonable mean-square range for rating-scale data is 0.6 to 1.4.
So this suggests that, though your misfit is statistically significant, it is not substantively significant. It is like a smudge on a pane of glass. It is definitely there, but it is not distorting what we see.
P_P September 20th, 2013, 11:10am:
Hi all,
1. I wonder about "fit statistics for analysed & interpreted the rater effects" (halo, restiction, centrality, accuracy, rater agreement)
2. Can I use Facets for analyses my measurement; 3 raters * 30 items* 1 examinee
Thank you very much
Mike.Linacre:
P_P:
1. Please Google for each of the statistics you want. Let's speculate about how we might investigate each of these:
a) Halo effect: the rater scores a series of items for each examinee, and the rating for the second and subsequent items is biased by the rating for the first item. So here is a procedure assuming the dataset is sufficiently large and crossed:
Analyze the dataset for all examinees, raters, items.
Output the Residualfile= which has the observed and expected values for all ratings.
For each rater, compute
i) for each examinee, for item 2 onwards, the sum of the squared differences between the observed ratings and the rating for item 1. Sum these across examinees, and then divide by the count of those ratings. This gives an observed mean-square-difference for the rater.
ii) for each examinee, for item 2 onwards, the sum of the squared differences between the expected ratings and the observed rating for item . Also add the model variance of the expected ratings for item 2 onwards. Sum these across examinees, and then divide by the count of those ratings. This gives an expected mean-square-difference for the rater.
iii) Divide (i) by (ii). The smaller the value less than 1.0, the bigger the halo effect.
b) range restriction, centrality:
i) analyze the data with the raters sharing the same rating scale.
ii) analyze the data with each rater to having a personal rating scale ŌĆ£#ŌĆ?.
iii) Compare the expected score ogives and category probability curves from (i) and (ii). Noticeable differences indicate differences in rater behavior.
c) accuracy:
For this, we need a reference set of ratings. For accuracy, compute the mean-square-difference for each rater between the observed and reference ratings
d) rater agreement:
There are three types of rater agreement:
i) raters agree with each other exactly. For each rater, compute the sum of the mean-square differences between the observed rating by the rater for an examinee on an item and the average rating by the other raters for that examinee on that item. Low mean-square differences = high agreement.
ii) raters agree on who is better and who is worse. For each rater, compute the correlation between the observed rating by the rater for an examinee on an item and the average rating by the other raters for that examinee on that item. High correlations = high agreement.
iii) raters agree on who passes and who fails. If there is a pass-fail cut point at the rating level, then rescore the data with ŌĆ£1ŌĆ? for pass and ŌĆ£0ŌĆ? for fail at the rating level, or if there is a pass-fail cut-point at the examinee level, then construct a new data set with ŌĆ£1ŌĆ? for pass and ŌĆ£0ŌĆ? for fail at the examinee level. Then do (ii). High correlations = high agreement.
2. 3 raters * 30 items* 1 examinee
Yes, you can analyze this with Facets, or its free student version, Minifac - www.winsteps.com/minifac.htm
There is only one examinee, so this is really a 3x30 rectangular dataset that can be analyzed by Winsteps, or its free student version, Ministep www.winsteps.com/ministep.htm
P_P:
Hi, Prof.Mike
IÆm very grateful for you help. And I had some continuous quessions.
1.For your explanation in c)accuracy. In the outputs for Facets (ratee estimation).
Can I compute the accuracy from;
[the observed ratings(logits) - the true (competent) ratings(logits)]
2.In self-peer-teacher rating, each group = 120 cases (1:1:1) or 120 pairs and total samples = 360 cases. Accoring to analysis and report, the number of raters is 3 raters(self-peer-teacher) or 120 raters(each person)?
3.I find two articles, explanation that:
restriction of range can identify from infit MnSq < 0.4 (rater estimates) and
inconsistency identify can identify from infit MnSq < 1.2 (rater estimates)
Can i do these? and inconsistency resemble the intrarater agreement?
Thank you for your kindness.
:) :) :) :) :)
Mike.Linacre:
P_P:
1. "Accuracy": Yes, we can compare the current estimated logit measures with the true measures, but where do the "the true (competent) ratings(logits)" come from?
If the "true" measures come from the current data, then we are looking at "precision" not "accuracy".
2. Everyone is a rater, so there are 360 raters. 120 are also ratees.
Rater + ratee -> rating
3. The rater mean-squares indicate the degree of agreement with the consensus of the raters. Low mean-squares = high agreement with the consensus. If the consensus has a restricted range, then low mean-squares can indicate a restricted range.
High mean-squares = low agreement with the consensus. The low agreement may be due to inconsistency.
uve September 18th, 2013, 11:40pm:
Mike
This question might not really be Rasch related but is related to equating. I'm running to this problem a bit more these days and would love to get your input. I know I've mentioned many times before our process for establishing performance levels by using an equipercentile method to link our exams with state assessments. The problem is that this year some of the items are being removed and are not being replaced. My question is how to best adjust the cut point. For example, if through equating it was determined that a respondent who scores at the minimum level of proficiency on the state test scores 25 out of 50 items on our district exam, then the cut point percentage is 50%. However, if 3 items are removed this year then should we retain 50%, which rounded down would equate to 23 items out of 47? Or do we retain the initial 25 point which would then be 25/47=53%?
Put another way, should I hold to the 50% cut point or hold to the 25 raw score cut point? I know that what really matters is the effect of the change on the difficulty of the test. I might be more inclined to anchor the 47 items this year and re-examine how students last year performed had they been given that form, however, I wouldn't know what the effect would be on its equipercentile ranking to the state exam unless I changed their scores. What that be viable? Thanks as always for your help.
Mike.Linacre:
Uve, one approach with Winsteps would be to reanalyze last year's data.
Table 20: 25/50 = M logits
Specification menu: IDELETE= the three removed items
Table 20: M logits = score S
this would give the score equivalent on a 47 item test.
chong September 17th, 2013, 12:37pm:
Hi Mike,
I want to compare the theoretical item hierarchy with the observed item hierarchy through Rasch analysis. My reading convinces me that it'd be much easier for me to communicate and interpret the results in terms of 'Level' the items are supposed to assess than using the default item calibrations (-2.26 to 1.92 logits). Given the construct consists of 4 levels (each level is assessed by 5 dichotomous items), my question is how to use Winsteps to rescale the default item difficulties to fit the theorized scoring range (1 to 4)?
Thank you in advance,
Chong
Mike.Linacre:
Thank you for your question, Chong.
The item difficulty range is -2.26 to 1.92 logits.
To make this 1 to 4
USCALE = 3 / (2.26+1.92) = 0.72
UIMEAN = 2.63
UDECIM=0
Or it may make more sense to use the range 0.51 to 4.49, and round:
USCALE = 3.98 / (2.26+1.92) = 0.95
UIMEAN = 2.64
UDECIM=0
ffwang September 12th, 2013, 6:01pm:
Hi all,
I am using TIMSS data for cross country comparisons. TIMSS suggested using Senate weight so that each country will have a sample size of 500 to draw fair and valid conclusions for the comparisons.
The problem I come across is that after using R+the weight and having it as a column right in front of the examinees, the Facts run but the reliability of separation estimate is 0 and the chi-square significance test is not significant. All these basically pointed out that the persons are the same, which is not true I think. So I read the Facets manual careful about weighting variables and found that it was mainly about weighting items and using a fixed weight for each facet or element, but I have many different weights for one facet.
So my questions are
1) what is the correct way of weighting person with many different weights?
2) which results (weighted or unweighted) I should report in my analysis so as not to make a misleading conclusion? I ran unweighted Facets with the same data, the examinees has good reliability of separation and significant chi-square test among all the four facets I am interested. But after using the weights, the person facet has reliability of 0 and non-significant chi-square test. In addition, the reliability of other facets are different after weighting.
Attached is my data. Please help me take a look and lots of thanks.
The code is as follows.
missing=999
Output = mathatt3 output.txt
Title = math attitude (Rating Scale Analysis) ;
Arrange = F,m ; tables output in Fit-ascending (F) and Measure-descending (m) order
Facets = 4 ; four facets: examinees, country, gender and items
Dvalue=4, 1-18
Pt-biserial = Y ; discrimination
Positive = 1, 2, 3, 4 ; for facet 1,2,3,4, positively oriented, high score=high measure
Noncenter = 1 ; only facet 1 allows to be free, that's examinees, doesn't have mean measure set to zero
Usort=U ; sort residuals by unexpectedness: ascending
Vertical=1*,2A,3A,4A ; Vertical rulers for facet 2, 3, and 4 labeled by name(not number "N"), facet 1 not label
Yardstick=0,5 ;
Model= ?,?,?,?, R4 ; four facets, rating scale model
z=,2
*
Labels =
1, examinees
1-20048 ; 20048 examinees for whom there is no more information
*
2, country
1=Germany
2=Hong Kong
3=USA
*
3, gender
1=female
2=male
* ; end of gender labels
4, items
1-18
1=I enjoy learning math.(r)
2=I wish I did not have to dstudy mathematics.
3=Mathematics is boring.
4=I learn many interesting things in mathematics.(r)
5=I like mathematics.(r)
6=It is important to do well in mathematics.(r)
7=I know what my teacher expects me to do.(r)
8=I think of things not related to the lesson.
9=My teacher is easy to understand.(r)
10=I am interested in what my teacher says.(r)
11=My teacher gives me interesting things to do. ?
12=I usually do well in math.(r)
13=Math is harder for me than for many of my classmates.
14=I am just not good at math.
15=I learn things quickly in math.(r)
16=I am good at working out difficult math problems.(r)
17=My teacher tells me I am good at math.(r)
18=Math is harder for me than any other subject.
* ; end of items4,examinees
Data=3ctryfinal.csv
Mike.Linacre:
ffwang, it sounds like your R weights are systematically too small.
1.) Analyze the unweighted data. These produce the correct reliability and separation for these data. Also verify that the analysis is functioning correctly.
2.) Apply your R weights and analyze the data. These will report a reliability and separation. Please verify that the count of data lines is correct. Your .csv file may not be in MS-DOS-text format.
3.) Adjust all the R weights by the same multiplicative constant to produce the reliability and separation in 1. A starting point is
multiplier = ((separation in 1.) / separation in 2.))**2
If you have a recent version of Facets, then you can use person-weighting instead of response-weighting. See "element weight" at https://www.winsteps.com/facetman/index.htm?labels.htm
ffwang:
Thank you, Mike.
I still feel confused. I ran Facets for two times with weights and without weights. The reliability of separation will definitely be different and for cross country comparisons, I want the weighted output but the output has problem because for the persons, the reliability is 0 and the chi-square significance test is not rejected. I checked the output, all data lines were read in so there is no problem of reading in data. So to me apparently something is wrong with the weighting I think. I wanted to weight person and I got the most recent Facet version but the manual is the same as before. So I couldn't find any information about how to weight persons. Can you point it out for me please?
Thanks a lot.
ffwang:
Attached are the outputs with weights and without weights.
Without weights:
|-------------------------------+--------------+---------------------+------+-------+---------------------|
| 56.7 17.7 3.21 3.23| 1.18 .44 | 1.05 -.1 1.05 .0| | .17 | Mean (Count: 20048) |
| 11.6 1.6 .58 .59| 1.26 .37 | .56 1.6 .64 1.5| | .15 | S.D. (Population) |
| 11.6 1.6 .58 .59| 1.26 .37 | .56 1.6 .64 1.5| | .15 | S.D. (Sample) |
+---------------------------------------------------------------------------------------------------------+
With extremes, Model, Populn: RMSE .57 Adj (True) S.D. 1.13 Separation 1.96 Strata 2.95 Reliability .79
With extremes, Model, Sample: RMSE .57 Adj (True) S.D. 1.13 Separation 1.96 Strata 2.95 Reliability .79
Without extremes, Model, Populn: RMSE .40 Adj (True) S.D. .90 Separation 2.25 Strata 3.34 Reliability .84
Without extremes, Model, Sample: RMSE .40 Adj (True) S.D. .90 Separation 2.25 Strata 3.34 Reliability .84
With extremes, Model, Fixed (all same) chi-square: 110414.7 d.f.: 20047 significance (probability): .00
With extremes, Model, Random (normal) chi-square: 13226.2 d.f.: 20046 significance (probability): 1.00
-----------------------------------------------------------------------------------------------------------
With Weights
|--------------------------------+--------------+----------------------+------+-------------+---------------------|
| 4.1 1.3 3.21 3.23 | 1.24 2.03 | 1.09 .6 1.07 .6 | | .29 | Mean (Count: 20048) |
| 3.0 .9 .58 .58 | 1.30 1.92 | .58 .6 .62 .6 | | .26 | S.D. (Population) |
| 3.0 .9 .58 .58 | 1.30 1.92 | .58 .6 .62 .6 | | .26 | S.D. (Sample) |
+-----------------------------------------------------------------------------------------------------------------+
With extremes, Model, Populn: RMSE 2.80 Adj (True) S.D. .00 Separation .00 Strata .33 Reliability .00
With extremes, Model, Sample: RMSE 2.80 Adj (True) S.D. .00 Separation .00 Strata .33 Reliability .00
Without extremes, Model, Populn: RMSE 1.94 Adj (True) S.D. .00 Separation .00 Strata .33 Reliability .00
Without extremes, Model, Sample: RMSE 1.94 Adj (True) S.D. .00 Separation .00 Strata .33 Reliability .00
With extremes, Model, Fixed (all same) chi-square: 8394.4 d.f.: 20047 significance (probability): 1.00
-------------------------------------------------------------------------------------------------------------------
I do not know why after weighting, the reliability of person facet become 0 and chi square test is not significant any more. All data seemed to read in appropriately.
Thanks.
Mike.Linacre:
ffwang, sorry, your weights are wrong.
The correct weights produce the same reliabilities as the unweighted data.
Please multiply all your weights by (2.80/0.57)**2 = 10.
Run the analysis.
Compare weighted and the original unweighted reliabilities.
Multiply the weights again until the weighted and unweighted reliabilities are the same.
ffwang:
Thank you very much, Mike.
So you mean I can use 2 times the ratio of RMSE as a starting point for the multipliers for the weights? Can I ask why? I know you mentioned using 2 times the ratio of separation between weighted and unweighted for the previous response? Can I also ask why? Does it matter which result (weighted or unweighted) to be used as the numerator or denominator because the multipliers will definitely be different?
Thank you very much!
ffwang:
Hi Mike,
I weighted the person using 2 times the ratio of weighted separation and unweighted separation after using 2 times the ratio of weighted RMSE and unweighted RMSE as a starting value. I weighted it four times and fives times.
The result after the 4th weight is as follows.
| 75.1 23.6 3.21 3.25 | 1.27 .47 | 1.09 .0 1.07 .0 | | .29 | Mean (Count: 20048) |
| 55.8 17.0 .58 .58 | 1.30 .45 | .58 2.0 .62 1.8 | | .26 | S.D. (Population) |
| 55.8 17.0 .58 .58 | 1.30 .45 | .58 2.0 .62 1.8 | | .26 | S.D. (Sample) |
+-----------------------------------------------------------------------------------------------------------------+
With extremes, Model, Populn: RMSE .65 Adj (True) S.D. 1.13 Separation 1.74 Strata 2.65 Reliability .75
With extremes, Model, Sample: RMSE .65 Adj (True) S.D. 1.13 Separation 1.74 Strata 2.65 Reliability .75
Without extremes, Model, Populn: RMSE .45 Adj (True) S.D. .92 Separation 2.05 Strata 3.06 Reliability .81
Without extremes, Model, Sample: RMSE .45 Adj (True) S.D. .92 Separation 2.05 Strata 3.06 Reliability .81
With extremes, Model, Fixed (all same) chi-square: 157135.7 d.f.: 20047 significance (probability): .00
With extremes, Model, Random (normal) chi-square: 13719.6 d.f.: 20046 significance (probability): 1.00
-------------------------------------------------------------------------------------------------------------------
And the unweighted result is as follows.
|-------------------------------+--------------+---------------------+------+-------+---------------------|
| 56.7 17.7 3.21 3.23| 1.18 .44 | 1.05 -.1 1.05 .0| | .17 | Mean (Count: 20048) |
| 11.6 1.6 .58 .59| 1.26 .37 | .56 1.6 .64 1.5| | .15 | S.D. (Population) |
| 11.6 1.6 .58 .59| 1.26 .37 | .56 1.6 .64 1.5| | .15 | S.D. (Sample) |
+---------------------------------------------------------------------------------------------------------+
With extremes, Model, Populn: RMSE .57 Adj (True) S.D. 1.13 Separation 1.96 Strata 2.95 Reliability .79
With extremes, Model, Sample: RMSE .57 Adj (True) S.D. 1.13 Separation 1.96 Strata 2.95 Reliability .79
Without extremes, Model, Populn: RMSE .40 Adj (True) S.D. .90 Separation 2.25 Strata 3.34 Reliability .84
Without extremes, Model, Sample: RMSE .40 Adj (True) S.D. .90 Separation 2.25 Strata 3.34 Reliability .84
With extremes, Model, Fixed (all same) chi-square: 110414.7 d.f.: 20047 significance (probability): .00
With extremes, Model, Random (normal) chi-square: 13226.2 d.f.: 20046 significance (probability): 1.00
-----------------------------------------------------------------------------------------------------------
As you can see that the reliability are quite close with weighted one being 0.75 and unweighted being 0.79. I weighted a fifth time and found the reliability estimates of weighted 0.86 and unweighted 0.79. Which result should I go with, 0.75 or 0.86? Would it be nice to have higher reliability estimate? If the weighted output has higher reliability estimate, what does that implicate? I always think the higher reliability the better because that means the s.e. is small. Thank you.
Mike.Linacre:
Yes, ffwang, higher reliability means smaller standard errors. This is because the Relaibility formula = (Observed variance - Error variance) / (Observed variance)
But, over-weighting the data is artificially reducing the standard errors. It is like adding artificial data into the analysis. Reliability = 0.86 is definitely much too high. Reliability = 0.75 says "our findings are .... or stronger". Reliability = 0.86 says "our findings are ... or weaker". The scientific approach is to be cautious because the weighting is already distorting the data. We don't want to claim findings that cannot be replicated.
ffwang:
Thank you very much, Mike. You are so brilliant.
For Facets, I think the default weight is 1, so is 1 the smallest system value for weighting variables in Facets? In addition, why do we use separation 1/separation2 ** 2 as a starting value for the multiplier?
In addition, can you recommend a book about weighting variables for me to read?
Thank you very much!
Mike.Linacre:
ffwang, you can use any positive value to weight in Facets. For instance, decimal values are usually used for census weighting.
If weight1 produces separation1, and weight2 produces separation2, then
weight1 approximates weight2*(separation 1/separation2)**2
Weighting variables: http://www.spsstools.net/Tutorials/WEIGHTING.pdf - ignore the SPSS instructions, unless you use SPSS.
ffwang: Thank you very much Mike. I love Facets and Rasch model!!!! All the best!
LauraA September 11th, 2013, 12:53pm:
Hi all,
I wonder if anybody can help me. I have been using Rasch analysis on 4-item, 7-item and 8-item scales. Although the summary statistics indicate a relatively good fit, the person separation index is consistently low (0.42-0.48 ). What could be causing this? Could the sample size be too small (n=183)?
Many thanks in advance for any help,
Best wishes
Laura
Mike.Linacre:
Thank you for your question, Laura.
Two things can increase the person separation index (= person Reliability)
1. A wider range of the person sample = bigger person sample S.D.
2. More items in the scales.
person Reliability is independent of person sample size.
If the person sample is representative of your target population, then we can use the Spearman-Brown Prophecy Formula to estimate the number of items we need. For example, suppose the C=4-item scale has a reliability of RC=0.42. We want a reliability of RT=0.80.
Then, T = C * RT * (1-RC) / ( (1-RT) * RC) where T=Target and C=Current
Target number of items = T= 4 * 0.8 * (1-0.42) / ((1-0.8)*0.42) = 22 items
Or for C=8 item scale with reliability RC=0.48, and target reliability RT= 0.8:
Target number of items = T= 8 * 0.8 * (1-0.48) / ((1-0.8)*0.48) = 35 items
ffwang: This is really nice to know. Thanks Mike. :)
LauraA:
Hi Mike,
Thank you so much for your help!
Best wishes
albert September 12th, 2013, 2:51am:
Hi,
I output the test information file, and plot that in the excel, and I am wondering how to interpret the peak of the function. Does it mean something about the targeting of the test?
Mike.Linacre:
Albert, at the peak of the test information function the standard error of measurement is the smallest. SEM = 1 / sqrt (test information)
Persons whose ability corresponds to the peak of the the TIF are measured most precisely.
albert:
Thanks, Mike.
I am now thinking of transforming the ability logit to scale score, and I could apply a linear transformation for all ability estimates, however, I am bit worried about the lower and upper end of the ability as the errors of those are large, and I am thinking of if there is way to determine a range by using the test information function, for example, is is appropriate to use the ability corresponding to the peak in the TIF and plus(minus) 2*standard deviation of the population ability estimate as the range that can be considered as precisely estimated?
Albert
Mike.Linacre: Albert, look at Winsteps Table 20, and choose the range for which the S.E. is acceptable to you. On the TIF, this is the range for the 1/S.E.**2 is acceptable.
albert September 12th, 2013, 2:07am:
Hi, Mike
I am wondering which output files include the the stats of test reliability>
Mike.Linacre:
Albert, Winsteps Table 3.1.
You can also compute the reliability from the PFILE=
albert:
Thanks, Mike>
is there a document about how to calculate this from PFile=?
Mike.Linacre:
Albert. To calculate reliability from the PFILE=
1. Output the PFILE= to Excel
2. Excel: compute variance of "Measure"
3. Excel: insert column next to "S.E."
4. Excel: column of S.E.**2
5. Excel: Average of S.E.**2 column
Reliability = 1 - (Average S.e.**2 of 5. / variance of 2. )
uve September 7th, 2013, 12:02am:
Mike,
I've noticed some odd output with point-biserial data. I re-ran some older files and they too have very different PB measures than before. The initial setting is: ptbiserial=x
Have any of the control commands changed or is the procedure different?
+-----------------------------------------------------------------------------------------------------------------------+
”ENTRY TOTAL TOTAL MODEL” INFIT ” OUTFIT ”PTMEASUR-EX”EXACT MATCH”ESTIM” ASYMPTOTE ” P- ” ” ”
”NUMBER SCORE COUNT MEASURE S.E. ”MNSQ ZEMP”MNSQ ZEMP”CORR. EXP.” OBS% EXP%”DISCR”LOWER UPPER”VALUE” RMSR” Item ”
+------------------------------------+----------+----------+-----------+-----------+-----+-----------+-----+------------”
” 23 25 147 1.26 .23”1.22 .9”1.46 1.3” -.92 .10” 82.3 83.0” .73” .06 .17” .17” .399” 23 ”
” 27 26 147 1.21 .22”1.11 .5”1.15 .5” -.91 .07” 81.0 82.3” .88” .03 .18” .18” .387” 27 ”
” 39 28 147 1.11 .22”1.17 .8”1.33 1.1” -.91 .10” 79.6 81.0” .77” .05 .19” .19” .408” 39 ”
” 34 29 147 1.07 .22”1.14 .7”1.42 1.4” -.90 .09” 80.3 80.4” .76” .06 1.00” .20” .408” 34 ”
” 58 30 147 1.02 .21”1.25 1.2”1.49 1.6” -.92 .12” 76.9 79.8” .63” .09 .20” .20” .433” 58 ”
Mike.Linacre:
Apologies, Uve. There is a bug in Ptbiserial=x which Voula reported two days ago. I have now isolated the bug and squashed it.
The amended version of Winsteps 3.80.1 will be available for download on Monday, Sept. 9, 2013. I have emailed download instructions to you.
uve:
Mike,
Thanks for fixing the bug. I did notice the outfit plots (Tables 9 and 5) are doing strange things, but this is not that big a deal for me since I normally use the scatterplot. Still, I thought I'd make you aware. I've tried them on several different data sets and they do the same but only in webpage mode. Notepad seems to work fine.
Mike.Linacre:
Thanks, Uve. There are too many options for me to test them all, so I am very grateful for any bug reports.
Is this the bug?
Specification menu dialog box: ASCII=Web
Output Tables: Table 9:
displays:
0 Ōö╝&# ;
uve:
Mike,
Yes, and the borders of the tables are scattered as well. Again, not that big of a problem for me since I use the scatterplot more, but this table is often helpful because of how it labels.
Mike.Linacre: Uve, the borders problem should be corrected. Have sent you the downlink for a test version.
tmhill September 6th, 2013, 12:29am:
Hi, Thanks in advance for helping me flush this out....
Are the terms Step Difficulty and Step Calibration synonymous?
Specifically, in the Elliott et al (2006) article, they talk about category thresholds defined as the estimated difficulties in choosing one response option over another. When I read the WINSTEPS manual, the Andrich threshold seems to be defined as the point at which the probability of selecting this response option and the preceding one are identical. I understand this to be somewhat of a difficulty estimate and I see where it falls on the graph.
I'm having trouble figuring out what the "category measure" column is telling me and why I use this instead of the Andrich threshold column for the 1.4 logits criterion. The Linacre (2002) article refers to the 1.4 criterion in regards to "step difficulty". Then, the WINSTEPs manual indicates that the Andrich threshold is also called "step difficulty." So would I apply that criterion to the Andrich threshold numbers, not the category measure numbers? And then what do I do with the first value in that column which is always "NONE"? Can you explain to me what the category measure column is conceptually? Is it on the graph?
Thanks!
Mike.Linacre:
Thank you for your question, tmhill.
Yes, Rasch terminology is ambiguous.
"Andrich thresholds" are the category-related parameters of Rasch rating-scale models. They are the locations on the latent variable, relative to item difficulty, at which adjacent categories of the rating-scale are equally probable.
For the Partial Credit model, there is ambiguity. The "Andrich threshold" is the location on the latent variable at which adjacent categories of the partial-credit scale are equally probable. In Winsteps, they are reported relative to the item difficulty. In ConQuest they are reported relative to the latent variable, i.e., including the item difficulty.
"Category measure" this can be:
1) The location on the latent variable at which the category is most probable to be observed. This is also the location at which the expected score on the item is the category value. This value is useful because it gives the most probable measure for a person based on that one item.
or
2) The average person ability of the persons observed in the category. This is vital for the Rasch model, because our theory is that "higher categories -> higher abilities" and "higher abilities -> higher categories". Accordingly we expect that average person measures advance with the categories.
The 1.4 criterion refers to Andrich thresholds. If we combine independent dichotomous items into a partial-credit super item, we will discover that the Andrich thresholds of the super-item advance by at least 1.4 logits.
There is one less Andrich threshold than there are categories because the thresholds are between categories. The thresholds are always identified with the higher category of the adjacent pair of categories, so there is no threshold for the bottom category.
OK? How are we doing?
windy September 4th, 2013, 7:42pm:
Hi, Dr. Linacre (and others).
I've noticed in some Facets analyses that sometimes all of the rating scale categories don't show up in the variable map when there are few observations in the categories.
For example, the attached data are some standard setting ratings where ratings could be between 1 and 100, so I used R100 in the model statement. The variable map shows fewer than 100 categories, and estimates are provided for only some of the categories in Table 8.1.
Can you please help me understand how Facets combines the categories?
Best,
Stefanie
Mike.Linacre:
Thank you for your question, Windy.
There are two options with R100: Ordinal or Cardinal category numbering.
A) If you want Cardinal category numbering (unobserved categories are active categories), please specify:
Models = ?,?,?, Myscale
Rating Scale = Myscale, R100, Keep
B) If you want Ordinal category numbering (unobserved categories are inactive categories), please specify:
Models = ?,?,?, Myscale
Rating Scale = Myscale, R100, Ordinal
Both of these only operate within the observed range of categories: 7-95
If you want all categories in the range 1-100, then please
1) add dummy data records to the analysis with observations of 1 and 100
2) Analyze the data using (A) above
3) Output an Anchorfile=
4) Copy the anchor values for the Rating Scale= into your analysis
5) Omit the dummy data
6) Reanalyze
Often percents are modeled as rating scales with a range 0-100. These use the B100 model instead of the R100 model. So that all categories in the range 0-100 are active.
A typical situation on a 0-100 scale is that observations clump. If so, it makes psychometric sense to renumber the categories. In your data, my choice would be to to divide the observed number by 5 and analyze the data on a 1-19 rating scale.
albert September 3rd, 2013, 10:45pm:
Hi, Mike:
I think I need some reference for the procedures to verify the unidimensionality under Rasch model for winsteps, is there any instructions on how to do it?
Moreover, given a test and its substrand, how to determine whether it is suitable for reporting subscale scores? can this be done through analysis in Winsteps?
s195404:
Hi Albert,
While you're waiting for Mike to respond, you could have a look in the Winsteps manual which has some good coverage of this issue. Tables 23.? are the outputs you need and there are two sections in the Special Topics chapter at the end of the manual ("Dimensionality: contrasts & variances" and "Dimensionality: when is a test multidimensional?").
If you run those tables and post some output, Mike will be able to give you expert advice.
With respect to sub-scales, the usual procedure is to run Winsteps over all the items and save the item and threshold values (via IFILE and SFILE). Then run the analysis again, making sure Winsteps fixes the item difficulties (via IAFILE and SAFILE), but this time select just the items pertaining to your sub-scale (via ISELECT). This means you can create as many sub-scales as you want and they'll all be comparable and on the same scale.
Regards,
Andrew Ward
Mike.Linacre:
Albert, that is good advice from Andrew.
Another thought about the substrand:
1) Analyze the full data set and output PFILE=pf.txt
2) Analyze only the substrand items. Use ISELECT= or IDELETE= to select the items.
3) Scatterplot the substrand person measures against the pf.txt measures. This will tell you in what ways the substrand and the overall person measures differ:
www.winsteps.com/winman/scatterplot.htm
albert September 3rd, 2013, 4:44am:
Hi, Mike:
Glad that in version 3.80, there was WMLE estimate. by looking at the manual about "PFILE=", the explanation of "MODLSE REALSE" is "Item calibration's standard error" and should this be "person's standard error", and I assume this was for MLE, and is there an error for wle?
Also, in the Person estimate file, I observed that the WMLEs for the same minimum and maximum raw scores are different, and some have very big numbers like 37.xxx, but the MLEs for the same minimum raw scores are the same though.
Do I need to specify the "EXTRSCORE=0.3" to make the extreme score have the same WMLEs? What is by default?
Thanks
Mike.Linacre:
Albert, thanks for reporting these problems. The WLE calculation is new in Winsteps and, though I have tested it on my own data, there is always more to learn. Albert, please email a Winsteps control and data file
"Item calibration's standard error" and should this be "person's standard error"
Reply: Oops, yes.
"and I assume this was for MLE, and is there an error for wle?"
Reply: the S.E.s are the same
"Also, in the Person estimate file, I observed that the WMLEs for the same minimum and maximum raw scores are different, and some have very big numbers like 37.xxx, but the MLEs for the same minimum raw scores are the same though."
Reply: Oops again. WLE and MLE estimates for extreme scores are not defined, so an extreme-score adjustment is applied. It must have malfunctioned. WLEs are almost always more central than MLEs. For extreme scores, the standard errors are usually large, so that the difference between the MLE and WLE estimates is usually very small. I am investigating.
"Do I need to specify the "EXTRSCORE=0.3" to make the extreme score have the same WMLEs? What is by default?"
Reply: EXTRSCORE=0.3 is the default. Something has gone wrong.
Albert, please email a Winsteps control and data file that produce these WLE numbers to mike \~/ winsteps.com
If the bug is straightforward to squash, it will be done within 24 hours.
Mike.Linacre: Bug in Winsteps discovered and squashed.
solenelcenit September 2nd, 2013, 4:53pm:
Dear Mike:
Congratulations for the new version Winsteps 3.80... you have worked so hard!!!
I've been looking around and trying to solve a problem I've got previously, and by the way I think the changes you have added to table 23 would give me a light!!.
The question is:
I got a questionnaire with 25 items, all to be scored with a rating scale for 0 to 4. I though to analyze this with a RSM, but unfortunately the uni-dimensionality criteria did not fit. Do you think I can name each cluster as a dimension? (This really would push me to forget the classical PCA!!)
So... I've pasted bellow some information... how many dimensions would you think there are? 2 or 3?
Approximate relationships between the PERSON measures
PCA ITEM Pearson Disattenuated Pearson+Extr Disattenuated+Extr
Contrast Clusters Correlation Correlation Correlation Correlation
1 1 - 3 0.4622 0.5977
1 1 - 2 0.5937 0.8123
1 2 - 3 0.6747 0.8481
Table of STANDARDIZED RESIDUAL variance (in Eigenvalue units)
-- Empirical -- Modeled
Total raw variance in observations = 42.3 100.0% 100.0%
Raw variance explained by measures = 19.3 45.7% 45.9%
Raw variance explained by persons = 7.4 17.5% 17.6%
Raw Variance explained by items = 11.9 28.1% 28.3%
Raw unexplained variance (total) = 23.0 54.3% 100.0% 54.1%
Unexplned variance in 1st contrast = 2.4 5.6% 10.3%
STANDARDIZED RESIDUAL CONTRAST 1 PLOT
-2 -1 0 1 2 3 4 5 6
-+-------+-------+-------+-------+-------+-------+-------+-------+- COUNT CLUSTER
.6 + | A + 1 1
| | |
C .5 + | B + 1 1
O | | |
N .4 + | C + 1 1
T | | |
R .3 + | +
A | E | D | 2 2
S .2 + H F G + 3 2
T | J | I | 2 2
.1 + | +
1 | | |
.0 +----------------|------------------------------------------------+
L | | |
O -.1 + |K + 1 3
A | | |
D -.2 + k L | + 2 3
I | |j | 1 3
N -.3 + fhig | + 4 3
G | d e | 2 3
-.4 + bc | + 2 3
| | |
-.5 + a | + 1 3
-+-------+-------+-------+-------+-------+-------+-------+-------+-
-2 -1 0 1 2 3 4 5 6
ITEM MEASURE
COUNT: 1 22431 22 1 1 22
Luis
Mike.Linacre:
Thank you for your question, Luis.
This output suggests that items A, B, C could be on a different dimension from the other items, but please look closely at the content of the items. Evidence:
Unexplned variance in 1st contrast = 2.4 5.6% 10.3%
PCA ITEM Pearson Disattenuated
Contrast Clusters Correlation Correlation
1 1 - 3 0.4622 0.5977
1 1 - 2 0.5937 0.8123
Devium August 29th, 2013, 5:49pm:
Dear Dr. Linacre,
I have some questions about how best to proceed with linking a set of tests using common items.
I have three base forms (F1, F2, F3) of a 50-item test that I want to link. I plan to create modified versions of these using anchor items.
To create the modified forms, I will use the first 10 items from F1 as anchors in F2 and F3. (IÆll call the anchors F1 1-10).
I will also create a fourth composite form using the F1 anchors, and the items from F2 and F3 that are ōdisplacedö by the anchors.
Thusly:
F1 F2 F3 F4
F1 1-10 F1 1-10 F1 1-10 F1 1-10
F1 11-50 F2 11-50 F3 11-50 F2 1-20
F3 1-20
Items F1-10 will be the same in all forms.
F4 will use the F1 anchors, plus items from F2 and F3.
(None of the forms is considered a ōbenchmarkö form. F1 was developed first, followed by F2 and F3. F1 is chosen as the anchor form arbitrarily.)
As I understand it, this will allow me to place F2 and F3 in the F1 frame of reference. I can, for example, determine the theta value for my pass score in F1 and find its equivalent in F2 and F3, thus linking all three tests.
Where I get confused is in how to actually run the analysis.
I think I can run all the items together as a super test (with missing data), using the F1 1-10 items as anchors.
But I think I can also analyze the anchor items separately, then use these fixed values to run F1, F2, and F3 separately.
Is there a preferred or ōbetterö way to link the tests? Am I on the right track?
Any advice you can provide would be greatly appreciated.
Thank you.
Mike.Linacre:
Devium, the choice is yours!
First analyze each form separately to verify that it is correct. At this stage, do not anchor (fixed, pre-set) any item difficulties.
If there is no requirement to keep the F1 results unchanged, then analyzing all the data together makes sense without any anchored item difficulties . In Winsteps, MFORMS= may make this easier.
If F! results cannot be changed, because, for instance, they have already been reported, then analyze F2, F3, F4 together, with items anchored at their F1 difficulties.
Devium:
Thank you Dr. Linacre!
I'll run an unanchored analysis for each test separately, to check for misfitting items, persons, etc. After I've cleaned those up, I'll re-run and check again for misfits. When I have "clean" data, I'll run an analysis on the whole set, using the F1 item difficulties from the "clean" set to anchor F2, and F3.
Thanks again for your helpful advice.
LF102 August 5th, 2013, 2:13pm:
Hi, so I've entered all my data into RUMM2030, pressed 'run analysis' and got a message saying "In estimating 31 item parameters, only 30 parameters converged after 999 iterations". Could anyone explain to me what that means? And how to rectify this problem?
Thanks.
Mike.Linacre:
Thank you for your question, LF102. It sounds like your data have an almost Guttman pattern. Do they look something like this?
00001
00011
00111
01111
Rasch analysis requires the data to include a random (probabilistic) component. Rasch data looks like this
00010
00101
01101
10111
LF102, what do your data look like?
Erik54: Try to change the converge value in "edit analyses specifications" to 0,01 or 0,001.
LF102:
Thanks for the replies.
I increased the converge value and it seemed to do the trick.
LF102:
I am currently analysing an 8-item disease-specific measure. I am not expecting it to fi the Rasch model, but I had to increase the converge value to 0.9 (!) to get the analysis to even run. The result is that the scale fits the model but the Person Seperation Index is very low. Does anyone know how I can interpret this, and is the analysis still valid even with such an extreme convergence value?
Thanks
Mike.Linacre:
Thank you for your question, LF102.
Low person separation is usually due to either (1) a test of only a few items, or (2) a person sample with a narrow score range. If your 8 items are dichotomies, then you will need a person measure location S.D. of at least 2 logits to obtain a reasonably large person separation. https://www.rasch.org/rmt/rmt71h.htm
The implications of the large convergence values are not clear. Suggestion: also analyze your data with a freeware Rasch program, such as the R statistics package eRm or, if your sample size is less than 76, Ministep, in order to verify your findings: www.rasch.org/software.htm
bluesy August 30th, 2013, 7:39am:
Hello,
I am analyzing some polytomous data using Winsteps and a Rating Scale Model. Looking at Tables 2.1, 2.2, 2.3, 2.4, 2.5, 2.6 and 2.7, I see the distributions of persons underneath each table.
I wonder if there is a way to access more detailed information on this distributional information through Winsteps, that is, the specific hierarchical order of the persons underneath each table?
I know this is not the typical hierarchical person ability order that is usually accessed, so, I don't know how to proceed.
Thanks in advance!
Mike.Linacre: Bluesy, the person distributions in Winsteps Table 2 should match the person ability measures reported in Winsteps Table 17.1.
bluesy:
Dear Dr Linacre,
OK, now I see what you mean. I just assumed they could have been different from the person ability measures as measured vertically up a Wright Map. For some reason (in my own confused mind) I thought they might have been different as scaled horizontally across these tables.
Thank you very much for your clear explanation as usual,
"your blood is worth bottling!" (highest compliment),
Bluesy.
mrmoj2001 August 29th, 2013, 3:04am:
Hi Mike,
I have three facets: item(4), rater(8 Native and 8 Non-native), essay( 8 ). I'm interested in finding bias interaction between raters and items. I've run FACETS and found some of the needed results. But in the literature I came across to a table like the following:
---------------------------------------------------------------------------------------
Bias/interaction between the rater-type and the item facet
Feature NNS rater NES rater
M SE M SE M Diff SE t (d.f.)
Content -.29 .05 .50 .05 -.79 .07 -11.53 (1633)*
Vocabulary -.19 .05 -.30 .05 .11 .07 1.59 (1631)
Grammar .10 .05 -.07 .05 .17 .07 2.46 (1626)*
Org. .43 .05 .07 .05 .36 .07 5.19 (1633)*
----------------------------------------------------------------------------------------
As far as I understood, facets does not produce a table with overall measures for each item. Can you help me figure out how can I come up with a similar table in my study.
Thank you very much
Moj
Mike.Linacre:
Moj, it looks like these numbers have been extracted from Facets Table 14.
Table 14.3.1.1 Bias/Interaction Pairwise Report
---------------------------------------------------------------------------------------------------------------
| Target | Target Obs-Exp Context | Target Obs-Exp Context | Target Joint Welch |
| N Junior | Measr S.E. Average N Senior sc | Measr S.E. Average N Senior sc |Contrast S.E. t d.f. Prob. |
---------------------------------------------------------------------------------------------------------------
| 4 David | .25 .29 1.54 2 Brahe | -1.05 .35 -.46 3 Cavendish | 1.30 .45 2.86 8 .0211 |
mrmoj2001:
Thank you; you'r right. But in table 14, for my data, there are many rows instead of one. I mean at least 50 rows foe each item. How can I come up with only one number for each measure? By the way I attached my Table.14 :)
Mike.Linacre:
Moj, the table in your first post shows the interactions between Features (4 elements: Content, ... ) and rater-type (2 elements, NNS and NES) = 4x2 = 8 interactions. Because there are only two rater-types, the pairwise comparison of Features by rater-type makes sense.
Your Table 14 shows the interactions between Items (4 elements) and Judges (7 elements) = 4x7 = 28 interactions. Probably, a list of the interactions, such as Facets Table 13, makes more sense than trying to represent these interactions by pairwise comparisons.
OK, Moj?
mrmoj2001:
Aha! Thank you for your kind help. Let me conclude: In fact, I have 8 NES judges and 8 NNS judges.I have treated them as two separate sets of data. Now, if merge the data from both groups and treat all NES judges as element 1 of facet judge, and all NNS judges as element 2 of facet judge, I will find a table like that. Something like this:
1,Judges, ; facet 1
1=
2=
*
2,Items
1=Content
2=organization
3=vocabulary
4=Grammar
Does it make sense?
Mike.Linacre:
Moj, there will be 16 judges and two judge-types:
1,Judge-type, A ; anchored at 0 - only used for interactions
1=NES, 0
2=NNS, 0
*
2, Judges
1-8 = NES
9-16 = NNS
*
3,Items
1=Content
2=organization
3=vocabulary
4=Grammar
*
4, ....
....
*
mrmoj2001:
OK. I got it. It was a great chance to get help from you.
Thank you again. :)
albert August 28th, 2013, 11:12pm:
Hi,
Is there a way to use token (for example, %test%) or loop in the control file? which makes it easier for massive production.
Thanks,
Mike.Linacre:
Albert, please use MS-DOS prompt or batch file tokens.
Here is an example of a batch file with tokens from www.winsteps.com/winman/simulated.htm
REM - initialize the loop counter
set /a test=1
:loop
REM - simulate a dataset - use anchor values to speed up processing (or use SINUMBER= to avoid this step)
START /WAIT c:\winsteps\WINSTEPS BATCH=YES example0.txt example0%loop%.out.txt PAFILE=pf.txt IAFILE=if.txt SAFILE=sf.txt SIFILE=SIFILE%test%.txt SISEED=0
REM - estimate from the simulated dataset
START /WAIT c:\winsteps\WINSTEPS BATCH=YES example0.txt data=SIFILE%test%.txt SIFILE%test%.out.txt pfile=pf%test%.txt ifile=if%test%.txt sfile=sf%test%.txt
REM - do 100 times
set /a test=%test%+1
if not "%test%"=="101" goto loop
PAUSE
albert:
Thanks, Mike.
I saw this example in the manual, and I think it would be better if Winsteps allow using tokens in control files.
s195404:
Hi there Albert,
What I do when I'm running Winsteps for lots of different scenarios is to generate the control files programmatically outside of Winsteps and then run them all in batch mode.
For instance, I use the R environment for statistics and graphics to prepare my data and my control files so that I don't manually have to create/edit any files for Winsteps. This means I can use tokens, complex logic, etc, to construct the control files and then execute them using Windows batch files (which I also generate programmatically). If you don't use R, then maybe awk, Perl, Python, etc, will help.
This approach of using a variety of tools in my analysis means that I can take advantage of each tool's strengths - it doesnÆt matter to me that Winsteps isnÆt a full-featured programming language, doesnÆt generate exactly the tables or graphs I want, or doesnÆt support advanced scripting. I have other tools for doing these things and so I only need Winsteps to do Rasch modelling. Nonetheless, I know that Mike has added many features to Winsteps in response to user requests.
If you'd like to give more details or an example of what you want to achieve, perhaps we can provide more specific advice.
Regards,
Andrew Ward
CelesteSA August 28th, 2013, 11:23am:
Hi there,
I have a problem and need help.
We administered a science test to 7 schools (14 year olds). Accidentally the anchor items that have to link this test to the next year's test was left out for 1 school's test. This means that for 8 anchor items, we do not have data for 1 school. Unfortunately it is also the best performing school.
I am hesitant to use multiple imputation, but we have to have these scores otherwise we won't be able to track progress. Could I somehow use rasch measures to more accurately impute the missing data?
Thanks!
Celeste
Mike.Linacre:
Celeste, do you need the observations or the raw scores?
If you analyze all 7 schools together, then you will obtain Rasch measures for all the students in the same frame of reference. For 6 schools there will be a direct relationship between "raw score on complete test" and "Rasch measure".
For one school there will be "Rasch measures" for students on the incomplete test. You can then assign to each of those students the raw score on the complete test for which the Rasch measure is the closest to the Rasch measure on the incomplete test.
If you need to impute individual responses, then it is easy. Each student is given a "1" on every item for which the Rasch item difficulty is less than the student's Rasch measure, and a "0" otherwise.
OK, Celeste?
CelesteSA:
Dear Dr. Linacre,
This sounds great! Forgive me for using slang, but you are blowing my mind!
I will use your advice and adjust scores accordingly, Rasch is so useful :D
Kind Regards,
Celeste
s195404 August 28th, 2013, 3:18am:
Dear Mike,
Following on from my recent posts ("Different group sizes for pseudo-equating"), I am now looking at various Table 23 outputs to check for scale-busting multidimensionality for my rating scale survey. My understanding is that I need to look for too-large eigenvalues in Table 23.0, such as in the row "Unexplned variance in 1st contrast", and for substantive differences between item groups in Table 23.2. I've already dropped items with high MNSQ values and have collapsed rating scale categories so am reasonably happy with how things look so far.
I have attached a file with some excerpts from Tables 23.0 and 23.2. The eigenvalue I don't like much is 3.3 for the first contrast, since this seems to mean that there is some undesirable structure in the residuals. When I compare the A,B,C and the a,b,c items in Table 23.2, I notice that these have two different scales (the first 3 are "How serious is ..." questions whereas the latter 3 are "How much do you agree that ..." questions). I'm not sure how much of a problem I have since I'd really like to combine the items into a single measure. Are there other outputs from the Table 23 series that might help me here?
I've done a factor analysis of the items (polychoric correlations and all) which yielded a multitude of factors (6 factors across 38 items, if I recall rightly). This result seemed very unhelpful to me, given how apparently related the items are (community attitudes on a narrow range of topics).
By the way, Mike, I appreciate your ever kind and helpful advice. I have been on mailing lists where questions about anything other than the most advanced or esoteric topics are met with derision. It's nice to know there is a "safe" forum for more basic or how-do-I questions about Rasch analysis.
Regards,
Andrew Ward
Mike.Linacre:
Thank you for sharing your output, Andrew.
In Table 23.0 we see this output:
Approximate relationships between the PERSON measures
PCA ITEM Pearson Disattenuated Pearson+Extr Disattenuated+Extr
Contrast Clusters Correlation Correlation Correlation Correlation
1 1 - 3 0.3101 0.5205 0.3567 0.6096
1 1 - 2 0.3430 1.0000 0.3755 1.0000
....
This tells us that there is only one Contrast between item clusters that is of statistical concern for the measurement of persons. It is the one you identified. There is considerable difference. The current version of Winsteps 3.80 displays the person measures underlying these correlations in Table 23.6, you can then cross-plot the person measures to help you decide whether the relationship is expressing one latent variable.
albert August 27th, 2013, 5:44am:
Hi,
Is the default in winstep using MLE for person estimate? How to do for WLE and EAP?
Thanks
albert: Found some reference about winsteps saying that it not support WLE or EAP.
Mike.Linacre:
Albert, the most recent version of Winsteps 3.80 produces WLE estimates. See bottom of www.winsteps.com/winman/estimation.htm
Winsteps does not produce EAP estimates but these can be estimated using the Winsteps item difficulties (or person abilities) and Excel: https://www.rasch.org/rmt/rmt163i.htm - you will need to specify a prior distribution for the person or item parameters.
In general, WLE and are more central than Winsteps JMLE estimates. EAP estimates may be more central or more diverse than JMLE estimates depending on the choice of prior distribution.
albert:
Thanks, Mike.
I just bought version 3.75, and can the license be applied to 3.80?
By the way, the link you provided " https://www.winsteps.com/winman/wle.htm" has error when accessing.
Mike.Linacre:
Yes, Albert, you should have received an automatic email which says how to update to Winsteps 3.80 - if you did not, please email me mike \at/ winsteps.com giving details of your Winsteps purchase.
The correct link is the bottom of https://www.winsteps.com/winman/estimation.htm
albert:
Thanks, Mike.
There is another question regarding the item anchor file. Is there a way to output the anchor file directly for use rather than copy the first two columns from the IFILE?
Mike.Linacre:
Albert, the IFILE= is usually in the correct format for an anchor file. Winsteps uses the first two columns of the IFILE= for anchoring and ignores the other columns.
first analysis:
IFILE = myifile.txt
second analysis:
IAFILE =myifile.txt
If you want the IFILE= to have only two columns, then please set the default field-selection options in "Output Files" menu, IFILE=, then click the "Select Fields" button:
https://www.winsteps.com/winman/index.htm?outputfilespecifications.htm
albert: Thanks so much, Mike.
richie885 August 27th, 2013, 1:58am:
Good evening,
I am beginning to learn facets. Error F 36 ALL data eliminated as extreme.
What's the problem?
Please help me. attached are the data files.
Mike.Linacre:
Richie885, please download and run the current version of Minifac from www.facets.com/minifac.htm
Facets 3.61.0 is not compatible with your version of Windows.
albert August 26th, 2013, 5:57am: Is there a way to distinguish skipped and unreached missing in Winstep? Ideally, just want to trade them differently for item and person estimates.
Mike.Linacre: Albert, you need two different missing-data codes in your data file. If you already have your Winsteps data file, then you can probably make the change using your text editor and "global replace". Exactly how depends on the codes in your data file and the capabilities of your text editor. For instance, with NotePad++ this can be done with one RegEx expression.
albert:
Thanks, Mike.
Say data have been scored as 0, 1, 7, 9 with 9 as skipped missing, and 7 as unreached missing. Should I do the following for item and person estimate?
For item: I specify CODE=01, and MISSCORE = 9
For person: I specify CODE=01, and MISSCORE = 79 (by anchoring item)
In this case, I need two control files to get the person estimate. is this correct?
Mike.Linacre:
Albert: everything not in CODES= is treated as missing. MISSCORE= specifies the scored value to assign to observations not in CODES=. The scored value of -1 means "ignore".
My guest is that you want this:
For the items:
CODES = 019
NEWSCORE = 010 ; 9 is scored 0
MISSING-SCORED = -1 ; so that observations of 7 are ignored
For the persons with anchored items:
CODES = 0197
NEWSCORE = 0100 ; 9 and 7 are scored 0
albert:
Thanks, Mike:
Do you mean "MISSING-SCORED = 7 ; so that observations of 7 are ignored" instead of "MISSING-SCORED = -1 ; so that observations of 7 are ignored1"?
Mike.Linacre:
Albert,
MISSING-SCORED= tells Winsteps what score is to be given to codes in the data that are not in CODES=.
For instance, on many educational tests all codes in the data that are not in CODES= must be incorrect responses, so are scored 0 = wrong
MISSING-SCORED=0
But in many surveys all codes in the data that are not in CODES= are unknown responses, so are scored -1 = ignore
MISSING-SCORED=-1
For more details, see https://www.winsteps.com/winman/misscore.htm
albert: well explained thanks.
s195404 August 16th, 2013, 4:57am:
Dear list,
I'm a regular user of Winsteps and, to a lesser extent, Facets, plus a lurker on this list. I hope a request for general advice about how to approach an analysis task wonÆt be too out of place.
I am working with a survey dataset consisting of about 16,000 responses to a set of rating scale items, all concerned with community attitudes to selected social issues. To shorten the telephone interview, respondents were randomly assigned to various blocks of items - in particular, persons were assigned to 2 out of 4 possible blocks of around 6-8 items, such that everyone was asked approximately 13-14 items each. Unfortunately, the randomisation didn't seem to go very well because the allocation to blocks was uneven: 6000 answered blocks A and C, 6000 answered blocks B and D, 2000 answered blocks B and C, and 2000 answered blocks A and D. Despite this, though, the number of respondents answering each question was about the same (around 8,000).
The idea is that we will derive item difficulties based on this dataset and then apply them to future cohorts. I am wondering about any possible effects on item difficulties and person measures of the uneven allocation of respondents to blocks. Is there anything special I should do with my analysis, or can I simply go ahead with a standard sort of Winsteps analysis?
I thought that perhaps I could look for differential effects in each of the blocks, as well as the usual checking of item and person fit statistics. What else should I be looking for? Is it worth treating block assignment as a facet and checking for differences in Facets?
Thank you in advance for your very kind help.
Regards,
Andrew Ward
Mike.Linacre:
Thank you for your questions, Andrew.
If the sample sizes for your blocks had been 50-100 respondents, then there would be concerns, but 2,000+ is huge. In fact, you might want to do a random split into two datasets so that you can make your estimates from one dataset and confirm them with the other dataset.
With this design, a Facets analysis would not tell you anything beyond a Winsteps analysis.
A procedure with Winsteps could be:
(i) Code each person label with its block pair
(ii) Analyze each block-pair separately to verify that it is functioning correctly
(iii) Combine the block-pair into one analysis using MFORMS= or whatever.
(iv) Do person subtotals by block-pair: we expect to see randomly equivalent person samples assigned to each block-pair
(v) Do Differential Group Functioning: item x person block-pair sample. We expect to see very few statistically significant effects, and no substantively large ones.
s195404:
Dear Mike,
Thank you very much for your (as always) speedy and helpful reply. I will try this out and report back with my results.
Regards,
Andrew Ward
s195404:
Dear Mike,
Thanks again for your comments. I've managed to do some runs with Winsteps and have a couple of questions about your advice, please - specifically with respect to your point v about Differential Group Functioning for my 4 groups of respondents.
I thought I would use Table 33. I have put the group membership as character 7 of my person label (1-7 = id, 8 = group, 9 = gender). In the first field in Table 33 I have DIF=$S8W1, but I'm not sure what the DPF= field should be. I know it relates to item groups but I don't quite know how to form these. Any further advice would be greatly appreciated.
With the DIF analysis (Table 30.2) I found that the largest DIF SIZE by class/item was only 0.12, so I assume that there isn't strong evidence for differences between groups. The corresponding value of Prob was 0.03, but since DIF SIZE was so small I wasn't going to worry too much.
Thanks again for your very kind help.
Regards,
Andrew Ward
Mike.Linacre:
Yes, Andrew, we need both size and significance to motivate us to action :-)
DPF= The item groups would be the blocks of items, so we need to code each item with the block to which it belongs. But the DIF analysis has probably told us all we need to know. "Nothing to see here. Move along!"
s195404:
Wonderful - thanks so much, Mike!
:D
uve August 22nd, 2013, 4:45pm:
Mike,
I was presented with an interesting challenge and would love to get your opinion. A common practice here is to use equipercentile ranking of instruments developed locally with more established and accepted assessments developed by our state or federal education agencies in order to establish performance level cut points for proficiency. For this project, there are four locally developed unit assessments. All four were given last year and we now have data for the state assessment for those same students. The problem is that the first two units have been virtually overhauled for this year. Units 3 and 4 will remain the same. My thoughts were to rank last yearÆs version of the first two units, then anchor the common items when we calibrate for this year and see how the changes have affected the cut points. But to be honest, IÆm not 100% confident in the common item anchoring process. ItÆs been my experience here that with enough new items added the common items will change significantly. Though this would hopefully not happen, IÆd like to plan for the worst.
HereÆs my question: if I correlate last yearÆs version to last yearÆs state assessments, could I adjust the linear relationship by plotting last and current (after it is given) yearÆs common items (unanchored) by the linear relationship developed by this plotting? If so, how?
Mike.Linacre:
This is a challenge, Uve.
"with enough new items added the common items will change significantly"
Oops! If this means that the difficulty order of the common items has changed, then the latent variable has changed its definition. It is as though we have a test of "word problems". Last year we were measuring "addition", but this year we are measuring "reading comprehension", even though some of the items look the same. (Years ago one of my clients had this type of situation with a skills test. Items that had been written to probe one skill were actually probing other different skills.) Here, then equipercentile equating makes sense. The only thing that is perhaps stable across these different latent variables is the distribution of the student population.
For the plotting situation, imagine that the tests were testing student "bulk". Last year's test was dominated by student height. This year's test is dominated by student weight. How would we compare the similar-looking numbers across years?
Is this the situation, Uve? Or have I misunderstood it .....
uve:
Mike,
It is my understanding that the construct was not intended to be changed. Here is what I believe contributes to the calibration changes: emphasis on standards changing, pacing guides changing, teacher mobility, increasing class sizes, leadership changes, district directives and focus changing every year, fluctuating levels of test administration fidelity, varying degrees of teacher belief in the validity of the assessments, scattered assessment completion rates, and fluctuating levels of student ability levels often tied to population changes. All the aforementioned reasons would explain in part why 75 to 90 percent of the assessment items get changed from time to time. Often new administrators enter the picture, are dissatisfied with what they see, want to start over, then they themselves leave and the cycle repeats with someone new. In fact, this current situation is occurring because one school has decided the district English program will not work for them and want to break away and do something different. I am not arguing the efficacy of this decision, but merely using it to further demonstrate how quickly things can change in one year. This is particularly interesting given that our elementary English adoption item calibrations had virtually no change at all this past year using a population of about 2,000 per grade level as compared to the base year which had only about 50 or so students. However, item calibration stability is a different issue than content alignment.
So in light of the volatility we experience here, I just want to make the best connection possible between the version given last year and what is being proposed for the current one for this one school site.
Mike.Linacre:
Yes, Uve. The latent variable has changed, so we must make compromises.
The situation now sounds similar to equating judges across judging sessions. We discovered that individual judge leniency is too unstable to be used as anchor values, but groups of judges maintain their average leniency. So group-anchoring is implemented in Facets.
However, the reasons you give suggest that there is not only change in the difficulty of individual items, but also overall drift of the items. Since everything is changing (items and student population), it looks like some decisions must be made:
(1) is the measurement to be item-based (criterion-referenced) or student-performance-based (norm referenced)?
(2) if it is to be item-based, what is the core group of items that set the standard? Perhaps it is the common items. If so, then group-anchoring of the items is probably the best that can be done.
marjorie August 22nd, 2013, 7:00pm:
Hi
We are planning to develop an assessment tool based on a polytomious scale (3 levels) that could have up to 50 items. Taking the assessment would imply about an hour and we think recruitment will be an issue. As we wanted to use Rasch analysis, we were told it would be a problem because it needed large sample and it is also what we found in many articles. I read small sample could be OK https://www.rasch.org/rmt/rmt74m.htm
Would 50 participants be OK in that particular case? Also, as we anticipate questions we looked for something in the literature that could justify that, but couldn't find anything recent.
Finally, this blog looks great, but as I'm really novice, I don't understand half of what it says. Does anyone as basic documentation suggestion to start with?
Thanks
Mike.Linacre:
Thank you for your questions, Marjorie.
Sample size depends a lot on your purposes. 50 participants is certainly enough for a pilot test of the instrument. But if the participant sample is intended to be a norming sample, then you will probably need at least 100 participants belonging to each crucial group within the population (e.g., males, females, blacks, whites, old, young, .....).
For the minimum sample size, we need at least 10 observations of every category of every item, i.e., at least 3x10 = 30 participants. With a small sample, this requires a sample well-targeted on the instrument. So 100 participants would be a much safer number.
Published "sample size" studies are usually aimed at large-scale high-stakes educational tests where the legal implications of pass-fail decisions can be very high. This is unlikely to be your situation. If it is, then you need at least 100 3-category items, may be more.
Hope this helps, Marjorie.
marjorie: Thank you M Linacre. If I understand well, 100 participants would be appropriate as a first step for an exploratory phase.
raschgirls August 20th, 2013, 11:54pm:
Hi,
I am running hierarchical linear modeling. I had a continuous variable that I Rasched using the partial credit model for polytomous items. I have been asked to center all of my variables by subtracting the mean of each variable. Is it recommended to center Rasched variables by subtracting the mean when trying to interpret interaction effects using hierarchical linear modeling or should they be left alone since the variable has already been transformed using Rasch analyses. Any insight would be greatly appreciated.
Mike.Linacre:
RG, "center all of my variables" - yes, you could do this. It would probably simplify subsequent analyses. Normalizing the the measures of each variable to have an S.D. of 1.0 would also simplify subsequent analyses.
But remember this would be the same as taking a sample of heights and weights and doing the same thing. Setting the mean height and weight of a sample of persons to 0, and the S.D. of the heights and weight to 1.0 would simplify later analyses, but would lose the connection to the substance of the original measurements.
So be sure to maintain an "audit trail" of your transformations, so that you can transform your findings backwards into the original Rasch metric. In the example of weight, for instance, it would make a big difference if your HLM finding back-transformed to "this nutrition program makes a 1 gram difference in weight" or to "this nutrition program makes a 10 kilogram difference in weight".
miet1602 August 20th, 2013, 11:24am:
We are setting up a study that aims to compare functioning/consistency of two types of mark schemes (when used for the same items and by the same markers). We are considering using Facets for some of the data analysis, and I am not sure whether our design is going to allow enough connectivity for Facets analysis. My other question is about the best model that would allow comparison of mark scheme functioning.
We will have 12 markers marking 6 extended response questions, with 40 responses for each question. I attach a doc file with the table showing the study design.
Is this design going to allow enough connectivity for Facets analysis?
I am also wondering how best to set up the models so that I can compare the functioning of each mark scheme type for individual items (markers?) as well as overall?
Many thanks for any advice on this.
Mike.Linacre:
Thank you for your questions, Miet1602.
Your design is connected enough for Facets, but it may make more sense as two separate analyses. You can then cross-plot equivalent sets of measures, fit statistics, etc., to identify which marking scheme is more discriminating ( = wider measure range), more consistent (= smaller fit statistics), more robust against differences in rater severity (narrower range of rater measures), etc.
Student123 August 13th, 2013, 9:34pm:
"1-parameter (Rasch) model..." (Harvey & Thomas, page 8 of 42 in pdf). "Unfortunately, the 1-parameter IRT model suffers from significant limitations, perhaps the most important being that it assumes that all items on the test are equally discriminating or informative. For many psychological tests (especially personality tests), this is probably an unrealistic assumption. That is, some test items are likely to be stronger indicators of an individualÆs underlying preferences than other test items (a fact that is acknowledged by the existing MBTI scoring system, which differentially weights items when computing preference scores)." (Harvey & Thomas, page 9 of 42 in pdf).
Source: http://harvey.psyc.vt.edu/Documents/JPT.pdf
I have read that rasch models assume approximately equal discrimination, but do they really a priori assume that every item is equally informative? Is not that a part of the local independency as stated in another thread "We also want the items to be as different as possible about that variable"?
I suppose my questions could be formulated: Is it really a limitation and not a benefit? And also a part of analysis to find out if the assumption holds?
Mike.Linacre:
Student123, you raise a good point.
Empirical items do have different item discriminations. Consequentially they also have different information functions. But the total amount of statistical "Fisher" information in dichotomous items is the same, regardless of the item discrimination.
A more discriminating item is more informative about a person whose "ability" is close to the item's "difficulty" than a less discriminating item, but is less informative about a person whose "ability" is far from the item's difficulty than a less discriminating item.
The Rasch-model "limitation", mentioned by Harvey & Thomas, is actually considered to be a virtue in all other measurement situations. We want all the marks on a tape measures to be equally discriminating. For the practical impact of unequal item discrimination on measurement in the social sciences, please see Ben Wright's paper, "IRT in the 1990s. Which models work best?" - https://www.rasch.org/rmt/rmt61a.htm
And, yes, investigation of the specification (not assumption) of equal item discrimination is a routine part of Rasch fit analysis.
Student123:
Thankyou for the informative answer.
The questions for the Myers-Briggs type indicator form M were selected with Item Response Theory (no information about the choosen model and it's hard to even find a reference to any of the "official" validation studies). Harvey & Thomas have been quite influental in the IRT-based research about MBTI and they prefer a Birnbaum model. It is possible that other MBTI-proponents follows Harvey's and Thomas recommendation.
After having read Wright's paper I wonder:
What does these validation-studies show if the Birnbaum model is choosen because it fits the data?
Have I misread Wright if I got the impression that Birnbaum models tend to be worthless when compared to Rasch models?
Mike.Linacre:
This is strange, Student 123. the MBTI Form M is conceptualized as 4 latent variables (E_I, S_N, T_F< J-P), so each latent variable can be analyzed separately with a unidimensional IRT model. However, MBTI does not have a "guessing" aspect (unlike multiple-choice questions), so Birnbaum's 3-PL IRT model is unsuitable for analyzing MBTI data. Perhaps "Birnbaum" is meant to indicate the 2-PL IRT model in which each item is modeled to have a difficulty and a discrimination. This is discussed in http://hbanaszak.mjr.uw.edu.pl/TempTxt/HarveyHammer_1998_IRT.pdf
2-PL IRT and 3-PL IRT models are useful descriptive models when the intention is to summarize the current dataset (with all its never-to-be-repeated idiosyncrasies). Rasch models are prescriptive models intended to surmount the idiosyncrasies of the current dataset and to support sample-independent inferences.
There is a parallel situation in many aspects of life. Consider your driving to work. Do you want to optimize your driving pattern based on the idiosyncrasies of your drive to work yesterday (including yesterday's roadworks, yesterday's weather, yesterday's flat tire, etc.)? If so, use an IRT model. Or do you want to optimize your driving pattern as independently as possible of yesterday's idiosyncrasies? If so, use Rasch.
This situation has also arisen in Industrial Quality Control. Detroit statisticians favored optimization for idiosyncrasies. Japanese statisticians favored optimization that is independent of idiosyncrasies. Who won? See https://www.rasch.org/rmt/rmt72j.htm
Student123:
I read the article more carefully now (it doesn't even have a clear method section), it turns out that they did use the 3-PL IRT Model and that the guessing parameter were meant to indicate if non-trivial numbers of respondents with preference for the opposite "non-keyed" pole of the dichotomy tends to choose response alternatives that indicates preference for the operationalized "keyed" pole (if I didn't misread them).
Thanks for making the basic purpose with the models very clear - it's helpful for a novice like me.
Would it be worth the trouble to examine the instrument's measurement properties with a Rasch model and then use some IRT model to describe the current dataset with all it's idiosyncrasies? Would the IRT analysis provide interesting information that is ignored by the Rasch model?
Mike.Linacre:
Student123, from your description of their analysis, they should have used a 4-PL model, so that preferences for both poles are parameterized.
"Ignored by the Rasch model?" - Since Rasch specifications are much more demanding on the data than 3-PL IRT assumptions, 3-PL IRT ignores aspects of the data that are reported by a Rasch analysis. A common complaint about Rasch is that "it ruins my test." This is because Rasch reports many types of flaw in a test that other analysis methods do not detect, or fail to report in a useful way if they are detected.
Student123: Allright, thankyou for the clarification. Now I have a answer to all criticism I might get for choosing a Rasch model to analyze data.
Mike.Linacre: Student123, if the criticisms are because the Rasch model is "wrong" in some way, then see https://www.rasch.org/rmt/rmt103e.htm
Phihlo July 23rd, 2013, 1:15pm:
Dear Mike.
Previously you send me the document on 'how to combine items or make testlets with Winsteps and Excel' which I find very useful-thanks.
My question is: how do I 'weight' the created super items? For example I have summed up 3 items making one super item in some cases 2 making another super item. The results shows super items with more items easier relative to others with 1. Could this be about the unequal Weighting of the super items? If so, how do I weight them?
Thanks in advance
Phihlo :)
Mike.Linacre:
Phihlo: the super-items are automatically correctly weighted. However, the mean difficulty of the items changes when separate items are collapsed into super-items. In this situation, either
(i) set the mean ability of the persons to be the same in both analyses,
UPMEAN=0 ; set the mean person ability at 0 logits
or
(ii) anchor an unchanged item at the same logit difficulty in both analyses,
IAFILE=*
1 0 ; anchor item 1 at 0 logits
*
Phihlo:
Dear Mike
Following instruction on the document:how to combine or make testlets.."I have set up the UPMEAN= 0and USCALE 1 intially on the screen showing "ministep control file set-up" . This means I decided to go with option (ii) above because I don't understand anchoring well
However, the results still showed superitems with more items easier relative to others with 1. Have tried with different set if data from different sample.
Somewhere I the document they talk about IWEIGHT= but is not clearly elaborated. Where have I gone wrong?
Please assist
Phihlo
Mike.Linacre:
Phihlo, you write: "the results still showed superitems with more items easier relative to others"
Weighting a superitem will not change its easiness. Weighting a super-item changes its influence on the person estimates. For instance, if we weight any easy item 50%, then the difficulty of that item will not change, but the person ability estimates will all increase a little relative to the overall difficulty of the items.
If you want to change the reported easiness of a superitem in the output reports without changing the data, then please use "pivot anchoring". The usual reported difficulty of a polytomous item (superitem) is the location on the latent variable at which the top and bottom scores on the item are equally probable. We can redefine the location by changing the computation for "easiness" for the item. But this is merely a cosmetic change. The person estimates will not change.
Phihlo:
Dear Mike
Thanks for elaborating this.
would you please assist me with a manual on pivot anchoring..I seem to struggle understanding the way it is explained on Rasch help function.
Is pivot achoring done after combining the items? If so how do I go about it after combining?
Phihl9
Mike.Linacre:
Phihlo, there is no problem defining the item difficulty of a standard dichotomous (right/wrong) item. It is the location on the latent variable where there is a 50% chance of success on the item.
Combining dichotomous items makes a polytomous superitem. But how do we define the difficulty of a superitem? Since the difficulty of a dichotomous item is the location on the latent variable where the top and bottom categories are equally probably (= 0.5), we apply the same logic to the superitem. Its difficulty is the location on the latent variable where the top and bottom categories are equally probably (= ???). But this definition does not make sense in every situation. So we need to choose another definition.
For instance, if a superitem is comprised of 3 dichotomous items (possible scores = 0,1,2,3) , we might define its difficulty as the location on the latent variable where the expected score on the item is 1.5. Or the location on the latent variable where scores of 1 and 2 are equally probable. Or the location on the latent variable where the expected score is 1.0 or maybe 2.0. Or .....
For these alternative definitions, we need to compute the distance of the chosen location from the standard location and then apply that distance to the item difficulty using "pivot anchoring" implemented in Winsteps with SAFILE=. We can usually discover the distance we want by looking at the GRFILE= output.
The procedure is:
(1) Analyze the data without pivot-anchoring
(2) Output SFILE=sf.txt which contains the standard Andrich thresholds
(3) Output GRFILE=gr.txt which contains the values connected with all the scores and probabilities on the item
(4) Identify the logit value corresponding to the desired location on the latent variable = M
(5) Subtract M from all the values for the superitem in SFILE=sf.txt
(6) The adjusted SFILE= is now specified as SAFILE=sf.txt, the pivot-anchor file
(7) Analyze the data with pivot-anchoring
( 8 ) The difficulty of the superitem should now have changed by the specified value, M
Phihlo:
Thank you very much Mike. I will try it out
Is there a possibility that I could get a document similar to that of "how to combine items" indicating step by step procedure but in this case the one on how to use 'Pivot anchoring"? I would appreciate that
Phihlo:
Dear Mike
Our research group has encountered a problem with data collected by graduate students.
Could you kindly explain-we have two data sets from two different samples on the same instrument. The person reliability is high (0.8) and the item reliability is 0.4 for both when run separately. When we combine both samples into a large data sample, the calculated person reliability remained at 0.8 but item reliability came out at 0.00. Would you kindly assist?
1. In general what does a low item reliability mean?
2. Why would we get zero reliability when combining the two samples?
Mike.Linacre:
Phihlo: something is wrong with the computation of item reliability. Reliabilities are dominated by sample size.
Person reliability is dominated by the number of items.
Item reliability is dominated by the number of persons. Low item reliability means that the person sample size is too small. If you increase the person sample size, then the item reliability must increase. In your case, the item reliability is 0.4 for both samples. Let's assume that the person sample sizes are about the same, then the item reliability for the combined samples will be about 0.6.
MStadler August 14th, 2013, 1:38pm:
Hi,
I have a problem with the extended rasch model software eRm.
http://cran.r-project.org/web/packages/eRm/index.html
To determine the relative importance of several item characteristics on the item difficulty I would like to calculate a linear rating scale model.
Unfortunately I do not understand how to tell the software (neither the R package, nor the SPSS extension), which variables are item characteristics and which are whether or not the item was solved.
As I understand it (which may very well be wrong) the model needs all of this information to calculate item difficulties as a function of item characteristics.
Does anyone have experience with this or is intrigued enough to discover it with me?
I would be really thankful for some help with this!
Cheerss,
Matthias
Mike.Linacre:
Matthias, it sounds like you want to estimate a "linear logistic test model" (LLTM).
Please analyze the R Statistics example dataset lltmdat2.rda - there is a brief description of it at http://statmath.wu-wien.ac.at/people/hatz/psychometrics/11s/RM_handouts_9.pdf
This example shows the data matrix and the design matrix needed to run LLTM with eRm.
tmhill August 13th, 2013, 12:48am: Is there an output table that specifically indetifies the percentage of min and max extreme scores? Or, is this something I need to put in the control file?
Mike.Linacre:
tmhill, Table 3.1 reports these counts: www.winsteps.com/winman/table3_1.htm
MAXIMUM EXTREME SCORE: 1 PERSON
MINIMUM EXTREME SCORE: 2 PERSON
Percentages are not reported, but are a great idea!
tmhill: Thank you!
tmhill August 13th, 2013, 12:36am:
The more we explore the instrument the deeper we are going with the items. I am wondering if a DIF is always necessary and is there specific instructions for reading the output tables? What I saw in the manual leaves me very confused.
Thanks!
Mike.Linacre: tmhill, we usually do a DIF analysis when we are concerned about whether some items in the test/instrument/questionnaire are biased for or against a group. For instance, biased against females, or biased in favor of an ethnic group. DIF analysis is often motivated by legal considerations.
tmhill: Thanks!
solenelcenit July 23rd, 2013, 9:10am:
Hil Mike:
I've got a problem with local dependency. Data is from a set of 7 itmes, each item has been scored with a rating scale form 0 to 4 by 500 individuals.
After examining all Rasch conditions to assure the robusteness of the meassures with a rating scale model, table 23 informs of higher correlations between two itmes (r=0.40), therefore there are three higher negative correlations (r>-0.3). After transforming these figures with Fishers Z I condlude that I have a problem... I've been examinig how to proceed, because I'm not sure about there is a "real dependency" between these items.
- How can I check the amount of the dependency between the items in Winsteps?
- If there is dependecy beteeen the items, how can I analyze in Winsteps the procedures described in https://www.rasch.org/rmt/rmt213b.htm?, It consist in creating a super-item with the dependent items.
Thanks
Luis
Mike.Linacre:
Thank you for your questions, Luis.
In practical terms, a correlation of r=0.40 is low dependency. The two items only have 0.4*0.4=0.16 of their variance in common. Correlations need to be around 0.7 before we are really concerned about dependency.
If you want to create a super-item, then use Excel (or similar) to add the scored responses on the two item together, and then include these in the data file. In Winsteps, use ISGROUPS= to model the additional super-item. You will notice a very small reduction in the variances of the measures.
Procedure:
1. Winsteps analyze the original data
2. Output the scored responses: "Output file", "RFILE=", responses.xls
3. In Excel, open responses.xls
4. Sum the scored responses of dependent items into a new item
5. Delete the original dependent items
6. Save responses.xls
7. In Winsteps, "Excel/RSSST" menu, "Excel", Import responses.xls
8. Create Winsteps file of the new set of items (you may need edit ISGROUPS=)
9. Analyze the new Winsteps control file
OK, Luis?
solenelcenit:
Dear Mike:
Thanks for your advises and step by step points.
As always you usually do, now I'm stumped... I agree with your explanation of residual correlations. Can you provide me any reference or author? I mean the Winsteps manual could is enought for me, but not for others... Therefore, I don't know why almost all Rasch users and papers are using the Cuttoff of r>0.3 between the residuals to flag the items as local dependent or not.
Regarding the super item... once the process has been carried out, what I might do? comparing the item locations and the indicators between the initial analysis and the "super item" analysis to study if there is a real effect of the local dependency previously detected?
Thanks!!
Luis
Mike.Linacre:
Luis:
You asked: "why almost all Rasch users and papers are using the Cuttoff of r>0.3"?
An equivalent question is "why do most statisticians use the cut-off p<=.05"
Answer: Tradition! Someone, somewhere, had a good reason for choosing the value, and everyone else has followed, whether it makes sense for their own analyses or not. This sheep-like mentality really annoyed Ronald A. Fisher, the originator of p<=.05, when he saw it applied in completely inappropriate situations.
r>0.3 is amazingly low. For the value of the cut-off correlation, do you really need a reference? Surely you can give a good substantive reason for your choice of cut-off value. Suggestion: use the Winsteps simulate function (Output Files menu) to simulate some sets of data like yours. Look at the distribution of the inter-item correlations (ICORFIL=). Choose an extreme value in the distribution as the cut-off. You can also show the distribution plot in your paper as evidence to support your cut-off value. Then you will become the reference that everyone cites!
Effect of local dependency? The important effect is on the person measures, so please cross-plot the two sets of measures, separate items and super-items. You will discover they are (almost) collinear and the the variance of the person measures with the super-items is slightly less than with the separate items. The practical significance of the difference is nothing in almost all circumstances.
solenelcenit:
Hi Mike:
I absolutely agree with you... sometimes scientists like to imitate the others assuming their rights and wrongs... this includes to Rasch reviewers, who like quotes but not their content.
This is very clear in what concerns our cutoff.... following the thread of references from different studies I've ended that any quoted study provide evidence of this cuttoff of >0.3. So: There is not such evidence and quotes from papers mislead the readers.
Thanks again Mike.
Luis
Mike.Linacre: Luis: if you do decide to set your own cut-off value, please write a short research note about it (400 words + Figure) and submit it to Rasch Measurement Transactions: editor ]at] rasch.org
solenelcenit:
Thanks Mike!!
It sounds good!!. Let me do it and sent to you.
Luis
solenelcenit:
Hi Mike:
This is what I've done:
1. I've generated a set of 30 simulations from the data. I'd tried to replicate as similar the data I have (SINUMBER = 30, SISEED = 0, SIEXTREME = Yes, SICOMPLETE = No).
2. I've exported the ICORFILE (PRCOMP=R) of each simulation to a single table.
3. I've conducted a Z test for the average of the correlations of each item using the 30 columns.
From the simulations: the item residual correlation are so low, there's any significant sign...
You suggested: "Choose an extreme value in the distribution as the cut-off. You can also show the distribution plot in your paper as evidence to support your cut-off value".
Which plot are you referring to...? As the correlation fomr the simulation studies are so low... how can I choose a cut-off value?
Thanks in advance for any hint that allows me to continue working!!
Luis
Mike.Linacre:
Your simulations confirm my own, Luis. Mine were done since my previous response to you. Unfortunately that approach is not helpful :-(
I have also tried to simulate the effect of local dependency on person measurement. Also unsuccessful so far. Even large local dependency has a very small effect on person measurement. This is good news for Rasch analysis, because my results indicate that the Rasch model is robust against local dependency. However, my simulations so far have not produced a cut-off value at which locally-dependent items should be combined into super-items. Theoretical work suggests that the inter-item correlation of residuals must be at least r=0.7 but perhaps even r=0.8 or r=0.9! It looks like r=0.3 is much, much too low.
At present, the scientific approach would be to do the analysis both ways (separate items, then combined items). Cross-plot the two sets of person measures. Inspect the plot to see whether combining the items makes any substantive difference.
solenelcenit:
Hi Mike!
Although we have not reached any clear answer, you have helped me to advance in this question and now I have scientific arguments to discuss this question.
I'll continue working and asking!!
Thanks!!
Luis
solenelcenit:
Dear Mike:
You said: "Theoretical work suggests that the inter-item correlation of residuals must be at least r=0.7 but perhaps even r=0.8 or r=0.9!"...
Would you point me if this works can be referenced? Are them published?
With regards
Luis
Mike.Linacre: Luis, I was using statistical first principles. Nothing published of which I know.
Student123:
Hi Dr. Lineacre.
I have searched for a source which states that r = 0,3 is too low as significance criteria for residual correlations but have not found any. Do you have any source I can refer to? Or is there no source available?
With regards,
S.
Mike.Linacre:
Luis, here is a general comment:
"Note that as the correlation r decrease by tenths, the r2 decreases by much more. A correlation of .50 only shows that 25 percent variance is in common; a correlation of .20 shows 4 percent in common; and a correlation of .10 shows 1 percent in common (or 99 percent not in common). Thus, squaring should be a healthy corrective to the tendency to consider low correlations, such as .20 and .30, as indicating a meaningful or practical covariation." http://www.hawaii.edu/powerkills/UC.HTM
Elina August 11th, 2013, 11:10am:
Hi Mike, this is my first week using Winsteps. IÆd want to link several tests. Each test has ~30 items and ~300 persons. Anchor items link tests 1&2, 2&3, 3&4 and 4&1, ~10 different anchors every time. I wonder is this what I should do:
First, I analyse each test separately. Then, from test 1 I get measures for anchors linking tests 1&2. I analyse test 2 using measures I got from analysis 1. (N. B. I only know how to use IANCHQ for anchors.) Now, I put datasets 1&2 together and I get new measures. I analyse test 3 using measures I got from analysing datasets 1&2 together. I put datasets 1&2&3 together and so on. Right?
ThereÆll be lots of missing data. Is it OK?
Mike.Linacre:
Thank you for your questions, Elina.
Missing data are OK. We expect to have missing data with this design.
Yes, first analyze each test separately. Confirm that each test functions correctly.
You could analyze the tests together in pairs, but it will be much easier, faster and more accurate to analyze all the test together. You can do this by cutting-and-pasting all 4 datasets into one dataset, or by using the Winsteps MFORMS= instruction: www.winsteps.com/winman/mforms.htm
helenC July 22nd, 2013, 1:44pm:
Hi again!!
I'm now trying to create a scoring key for my questionnaire. Responses are coded 0 and 1 (yes/no). I just can't work out what value to assign to 0 and 1 for each item! Which table do I look at? Is there a simple way to do this (feels like I am missing something very obvious!). Furthermore...is there an easy way to then rescore it to a 0-100 scale?
Thank you SO SO much for ANY help!!!!
Best wishes
Helen
Mike.Linacre:
Helen, is the test supposed to measure something? If so, score the items so that a score of "1" means "more" of what you are looking for, and a score of "0" means less of what you are looking for. Then the scoring key is the string of "more" responses, something like:
KEY1 = 0011010101100.....
For the 0-100 scale: analyze your data, then look at Winsteps (or Ministep) Table 20. It shows values of UIMEAN= and USCALE= that produce measures in the range 0-100.
helenC:
Hi Professor Linacre - thank you for your reply. Yes, the test measures a type of behaviour and there are a total of 29 statements which people either say 'yes' or 'no' to. A 'yes' indicates a higher value of the trait.
But where do I can the logit values that represent a 1 or a 0 for each item? THat is how I thought the scoring key would work? (i.e. add up all the logit values for each item and divide by the number of items responded to) I want people to be able to do the test, and then look at the raw score and convert it either to a logit score or the 0-100 scale. Sorry to bother you...again!!
Helen
Mike.Linacre:
Helen: for the raw score to logit-measure conversion, look at Winsteps Table 20. If you want a range of 0-100, then put the values of USCALE= and UIMEAN= shown in Table 20 into your Winsteps control file.
Winsteps Table 20 also shows approximate values for converting raw scores to logits with a linear transformation.
Example: Predicting Measure from Score: Measure = Score * .1158 + -4.5099
ppp: hi - i wonder how do i convert raw scores into logit scors on ministep? thanks
Mike.Linacre: ppp, Ministep Table 20 shows the conversion between raw scores and logits.
helenC:
Dear Professor Linacre
Thank you for your reply. I have looked at table 20, I just have another question:
Does this only hold if the paerson answers every question on the test? What happens if they answer only a few?
Is there a way of working out a logit score for each individual item and then dividing by the number answered? Or do you just add up the item measures for each item they score 'yes' to and give them '0' if they score 'no'? and then divide by the number of items answered?
Again, thank you for your patience and help,
Best wishes
Helen
Mike.Linacre:
Helen, if someone only answers a few questions, then it really matters which questions they were. The five easiest questions? The five hardest questions?
If you need a quick, short-cut computation, then PROX is the best we can do:
person measure in logits = (average of the administered item difficulties) + [ln(count of successes/count of failures)]* ( 1 + variance(item difficulties)/2.9 )
If the item difficulties are close together, then this approximates:
person measure in logits = (average of the administered item difficulties) + [ln(count of successes/count of failures)]
helenC:
Thank you for the quick reply.
Can I check then - it would be ok to put table 20 in a paper and call this the scoring key?
However, if the person only answered a few of the items I would use the equations you have outlined - but that is not a key, this would need to be computed for each individual doing the test?
Again, sorry to keep bothering you - I just want to absolutely sure that I understand
Thank you
helenC: Also...I am unsure what "variance(item difficulties)" refers to? Thank you again!
Mike.Linacre:
variance(item difficulties) means "please compute the variance of the item difficulties and use that number here"
Variance = S.D.2
helenC:
Thank you so much, that is really helpful. And I am assuming one can use either logits OR the converted USCALE (0-100) score in those equations?
Thanks!!!
Mike.Linacre:
helenC, for USCALE= units,
person measure in uscale units = (average of the administered item difficulties in uscale units) + [ln(count of successes/count of failures)]* ( 1 + variance(item difficulties)/2.9 ) * uscale
helenC:
Dear Mike - thank you SO much for all your help and assistance. I appologise for not responding sooner (I don't get much chance to sit down at the computer working part-time). However, I just wanted to let you know that you have helped me so much and I really appreciate all your help!
Many thanks
Helen Court
uve July 31st, 2013, 11:22pm:
Mike,
In the article: https://www.rasch.org/rmt/rmt264b.htm, Engelhard provides an example of peaks and valleys for a person response function (PRF). IÆm assuming the dip seen in the ōcarelessö graph is used because it is located above the .50 probability line and the bump seen in the ōguessingö graph is used because it is below the .50 line. Otherwise we could say that the bump in the careless graph is really a lucky guess and the dip in the guessing graph is really carelessness. Or is a different criterion used to make this distinction?
I attempted this technique using the smoothing function for many different respondents with varying degrees of fit but never quite got the dramatic effect seen in this article. Interestingly, before I superimposed the z-scores, the lack of dip seen in the expected probability line for the items above the .50 line, especially the first few items, would have led me to believe these incorrect responses were not significant, though intuitively it didnÆt make sense.
I think maybe my graph (attached) is a modified graphical version of the Winsteps Keyform. IÆm wondering if the Engelhard article is a technique better suited to smaller number of items, or for a completely different purpose altogether.
Mike.Linacre:
Uve, Engelhard's response patterns are artificial and extreme.
In Winsteps, use "output file", "transpose", then analyze the persons as items. Set USCALE=-1. You can then get an empirical ICC for every person, much like Engelhard's. [There is a bug in the current Winsteps, so that the Model ICC does not reverse when USCALE=-1]
Generally, we do not have the resources to investigate individuals' response patterns. Trimming the sample based on person OUTFIT and INFIT is good enough. We expect the responses by a person to be much more noisy than the responses to an item, so it is difficulty to assess statistical significance.
uve:
Thanks Mike. Winsteps didn't like that I had letter codes and a key. It came back with an error message:
NONE OF YOUR RESPONSES ARE SCORED 1 OR ABOVE.
CHECK VARIABLES: CODES=, RESCOR=, NEWSCR=, KEY1=, IVALUE?=
Oops! Use "Edit" menu to make corrections, then restart
So,I first had to use the RFILE and copied the responses which were now 0,1 and pasted them over the original file and deleted the codes command and key in the control portion. After doing this and expanding the empirical x-axis interval to .01, it seems Winsteps interpreting the 0,1 as zero and 100%. You can see them in the attachment.
So not sure how this procedure will work.
Mike.Linacre:
Sorry, Uve. Yes, the scored file.
An easy way to handle this is to use "Output Files", IPMATRIX= with rows as Items and Columns as persons to write the scored responses to a permanent Excel file. Include the person and item labels.
Then use the Winsteps Excel/RSSST to format the Excel file as a Winsteps control and data file.
Launch Winsteps.
uve:
Mike,
I tried this and it worked as well; however, when I increase the x-axis interval so that I can see all 43 expected probabilities, all empirical marks are either at 1 at the top or zero at the bottom. I'm not getting the the type of empirical curve I provided in the initial attachment but just like the second attachment. Another strange thing I notice is that there should only be 43 rows, which were initially the 43 items and are now the "persons", but in the file there are 86 now.
I couldn't use Excel because there were almost 1500 respondents, which are now items (columns) and Excel only goes to 254, so I used SPSS. In SPSS, there are only 43 "cases" and 1485 "items", so that wasn't a problem. When I used the import function in Winsteps, the "items" and "cases" appear in the control file where they should but with 86 cases now. I thought perhaps that there might be some limite in the number of columns Winsteps can handle or that Notepad can display.
Not sure where to go from here though. Thanks for your patience and help.
Mike.Linacre:
Uve: "all empirical marks are either at 1 at the top or zero at the bottom". That is correct. Empirically, every observation is 1 or 0. When we spread out the items so that we can see every item separately, we see the observations: 1 or 0.
The Excel option can work: use IDELETE= or ISELECT= from the "Specification" menu box to choose 250 persons of interest.
86 cases? Strange! I must try this myself.
Winsteps can usually handle line lengths of up to 65,536 characters, and more under some circumstances. The standard version of NotePad appears to have a 1024 character maximum linelength. The maximum linelength for NotePad++ is over 20 million characters.
uve July 31st, 2013, 7:17pm:
Mike,
In reviewing some of the recent posts on variance explained by the model, I realize that I am having difficulty in understanding the value of this concept. It seems that the CAT process is gaining more momentum and if I understand it correctly, this could mean that variance explained might be zero for many analyses in the future. Even for current traditional testing situations, if the distribution of scores is highly constrained for a test which is difficult, one in which the average person measures is zero, then explained variance will be very low to possibly zero. But this appears to me to be relatively independent of more important issues such as validity and reliability. I guess IÆm failing to see how large explained/unexplained variance provides much in the way of valuable interpretive information other than how ōwellö the instrument targets the respondents. In fact, in many of the data sets IÆve seen, the closer the targeting and the lessening of explained variance, the more I see items targeted to both high and low performers/respondents along with those in between. So though it doesnÆt initially make intuitive sense, in my world it makes more sense to have lower explained variance for dichotomous data. IÆm not sure how this translates to polytomous data. What do you typically do with variance information in the way of interpretation and application?
Mike.Linacre:
Uve, you are exactly correct. "Explained variance" may be helpful for choosing between descriptive models, such as regression models, but is next to useless for measurement models, such as Rasch models.
For instance, CAT tests. These deliberately omit observations which have high explained-variance (such as easy items correctly answered and hard items incorrectly answered). CAT tests choose items with low explained variance because these have the highest degree of prior uncertainty, and so the highest probability that we will learn something useful from the item response. In CAT testing, we do not responses for which we can say, "Of course, the respondent answered that way. I knew that person would!"
Conventional CAT selection for polytomous items is to select items with maximum (new) information. This is the same as choosing items with minimum explained variance.
ybae3 July 29th, 2013, 3:44pm:
Dear Dr. Linacre,
I always appreciate your advice!
I have Rasch person-item map with the level of children's depressive symptoms at the left side and the difficulty of the symptoms at the right side. Can I read that a child who is located at the top might have more depressive symptoms than a child who is located at the bottom? Also, can I read that a item which is located at the top is more difficult one than a item which is located at the bottom? I saw one article and it described a map with a different way compared to mine.
As you can see my map, all of children are located under M=0. Can I interpret that most of them do not have depressive symptoms. However, some children who are located between -1 and -2 might be at risk of depressive problems.
PERSONS MAP OF ITEMS
<more>|<rare>
2 +
|
| Q8
|
|S Q11 Q13 Q15
1 + Q4
|
|
| Q7
| Q14 Q2 Q3 Q9
0 +M
| Q6
|
| Q12
|
-1 . + Q16
|S Q10
|
. T|
| Q1
-2 # +
|T
.# | Q5
.## |
.# S|
-3 #### +
|
.### |
##### |
|
-4 .###### M+
|
.## |
|
|
-5 ####### S+
|
|
|
.##### |
-6 +
<less>|<frequ>
EACH '#' IS 2.
Mike.Linacre:
Thank you for your questions, Youlmi. Yes, your interpretation of the map is correct, but the word "difficult" probably does not apply here. Are there a words for symptoms that are rarely observed (=difficult) and often observed (=easy)?
Do your items have a rating scale? If so, Winsteps Table 2.2 is much easier to explain than this map, and we would need to know the definitions of the rating-scale categories.
Let's assume that this is a yes/no symptom checklist. Then we can say Q5 is the most often reported symptom, and Q8 is the least often reported symptom. In your Winsteps control file, please add a one word summary of the item to the item label e.g. "Q8 suicidal" and "Q5 unhappy", then the meaning of this item map will be much clearer. For the persons, the people down at -5 and -6 logits have 0 or 1 symptoms. The person at -1 logit has 4 symptom on a yes/no checklist, but this really looks like the map of items with rating scales (or there is missing data).
ybae3:
Thank you for your advice!
I think that two words, 'rarely observed' and 'often observed', are appropriate for my data. These data were collected from parents who observed their children's behaviors related to depressive symptoms.
You Write: Do your items have a rating scale? If so, Winsteps Table 2.2 is much easier to explain than this map, and we would need to know the definitions of the rating-scale categories.
Reply: My items have a 4-point rating scale (1 for Strongly Disagree. 2 for Disagree, 3 for Agree, & 4 for Strongly Agree). The following is Table 2.2 with my data:
TABLE 2.2 Jul 30 9:00 2013
INPUT: 100 PERSONS 16 ITEMS MEASURED: 83 PERSONS 16 ITEMS 4 CATS 3.62.1
--------------------------------------------------------------------------------
EXPECTED SCORE: MEAN (Rasch-score-point threshold, ":" indicates Rasch-half-point threshold) (ILLUSTRATED BY AN OBSERVED CATEGORY)
-7 -5 -3 -1 1 3 5 7
|-------+-------+-------+-------+-------+-------+-------| NUM ITEM
1 1 : 2 : 3 : 4 4 8 scary/sad play
| |
1 1 : 2 : 3 : 4 4 13 overly guilty
1 1 : 2 : 3 : 4 4 15 act younger
1 1 : 2 : 3 : 4 4 11 no reaction to exciting/upsetting
1 1 : 2 : 3 : 4 4 4 not to be as excited about play/activities
| |
1 1 : 2 : 3 : 4 4 7 keeps to him/herself
1 1 : 2 : 3 : 4 4 9 blames him/herself
1 1 : 2 : 3 : 4 4 3 trouble following directions/rules
1 1 : 2 : 3 : 4 4 2 appers/say sad
1 1 : 2 : 3 : 4 4 14 no gain/lose weight
| |
1 1 : 2 : 3 : 4 4 6 can't pay attention
| |
1 1 : 2 : 3 : 4 4 12 seems to be very tired/low energy
| |
1 1 : 2 : 3 : 4 4 16 more irritable/grouchy
1 1 : 2 : 3 : 4 4 10 lack confidence
| |
| |
1 1 : 2 : 3 : 4 4 1 always interested(*reverse coded item)
| |
| |
1 1 : 2 : 3 : 4 4 5 whines/cries a lot
|-------+-------+-------+-------+-------+-------+-------| NUM ITEM
-7 -5 -3 -1 1 3 5 7
1 1 1
1 4 5 392683532 1 1 PERSONS
T S M S T
My Question: I can see which items are frequently observed or rarely observed above table but no information about each child's location, am I right? If so, I would need to see person-item map. Then, is it important meaning of M=0? I interpret the meaning of M=0 as children, who are located below M=0, might be no risk of depression. Am I right on the track?
I also have another question for deciding unidimensionality for my data. Variance explained by measure is 52.6% and unexplained variance in 1st contrast (eigenvalue) is 1.9 so that I decided the checklist has unidimensionality. Based on my knowledge of Rasch dimensionality, variance explained by measure should be over 60% to satisfy unidimensionality. Also, one article describes that "the Rasch model accounted for 59.6% of the variance in the observations, exceeding recommendations of at least 50% of variance accounted for (Linacre, 1992)" I tried to buy a reference,'Many faceted Rasch Measurement' by online website but it is hard to get it. So, I would like to it is okay to make decision for unidimensionality by using 'recommendations of at least 50% of variance accounted for'.
I am enjoying to apply Rasch model to my data even though I have faced at some challenges :-) Your mentoring is great help to overcome these challenges. I really appreciate for this!
Mike.Linacre:
youlmi, please notice the person distribution below the map. It is the same as in Table 1.0. We can see that the child with the most observed symptoms is at -1. He is at the "3" level of the most-often-observed item "whines/cries a lot", and is at the 1.5 level of the least-often-observed item "scary/sad play". The mean of the children is at "M" below the plot. The average child "M" is at the 2 level of "whines" and the 1 level of "scary". There are 13 children exactly at "M". Do you see that?
"variance explained by measure should be over 60% to satisfy unidimensionality" - that is not correct. Linacre, 1992, is obsolete. Please see https://www.rasch.org/rmt/rmt201a.htm . In its Figure 3, we can see that your person variance is about 1 logit. This is around 50% expected variance-explained when the data fit the model. Yours is at 59%. No problem there
Eigenvalue of 1.9 is also only slightly unexpected. See https://www.rasch.org/rmt/rmt233f.htm for the expected sizes of the largest eigenvalues.
Youlmi, Rasch methodology is advancing quickly. So please verify any finding based on research over 10 years old. Imagine the same situation in astrophysics, medicine, sports science. We would not put much trust in a research report 20 years old. We would definitely verify that it had not been superseded.
ybae3:
Thank you, Dr. Linacre!
Yes, I see the children related to the most-often-observed and the least-often-observed items. Does 'level' mean 'category'? I am unsure how to interpret that "The average child "M" is at the 2 level of "whines" and the 1 level of "scary". Could you give me any advice for this?
In my data variance explained by meausre is 52.6%. I think I have no problem because it exceeds 50% expected variance-explained, am I right?
Thanks again. It is great help!
Mike.Linacre:
Youlmi, your sample of children is really much to undepressed for this instrument. We need some children at +2 and +3 logits in order to verify the functioning of categories 3 and 4 for these items.
Yes, level means "category", but this plot shows averaged categories. Averaged categories advance smoothly from 1 to 4. That is how we can get to level 1.5. The values in this plot match the item's ICC (also called IRF). See www.winsteps.com/winman/index.htm?expectedscoreicc.htm
Yes, 50% explained variance is what we would expect for this set of items and this sample of persons.
ybae3:
Thank you, Dr. Linacre!
The instrument that is used for my study is screening tool for identifying depressive symptoms of preschool children. Yes, my samples look like typical children. I will find other children to verify the function of categories 3 & 4:-)
Thanks again for your guidance!
Sincerely,
Youlmi
dcb July 30th, 2013, 12:54am:
I would like to ask two very basic questions.
I have data from a vocabulary test which is in development, as follows:
1. We are trialling 70 items, though the intention is that the test will eventually include only 30 items. In this trial data was collected from 151 participants, but it was not possible to have the participants complete all 70 items. Thus 10 items were given to all 151 participants, with three sets of 20 items given to three groups of approx. 50 participants.
2. Each item can receive a score of between 0 and 3.
3. We wish to trial 5 different ways of marking the responses.
We are thus seeking to find out (a) which items work best, and (b) which method of marking works best.
My two initial question for this forum are thus:
(1) Can Winsteps do what we want to do, or do I need Facets?
(2) Do we have enough participants or should I seek to collect further data?
Mike.Linacre:
Thank you for these questions, dcb.
The general rule is "use Winsteps whenever possible in preference to Facets". For your analyses, Winsteps is fine.
Your sample size is adequate for trialing marking systems. For the 70 items, verify that at least 30 participants have responded to every item.
Only collect further data when it becomes obvious that there is not enough to produce decisive findings, and then only collect relevant data.
dcb:
Thank you very much for the reply.
"For the 70 items, verify that at least 30 participants have responded to every item."
We do not have any participants who have responded to all 70 items. Due to time constraints, it is only possible to have each participant respond to 30 items. Thus 10 items were given to all 151 participants, along with one of three sets of 20 items.
In other words:
Items 1- 10 - responses from all 151 participants
Items 11-30 - responses from participants 001-049
Items 31-50 - responses from participants 050-098
Items 61-50 - responses from participants 099-151
Mike.Linacre:
dcb, that is good.
Some items may only have a few responses in some score categories, but this will alert you that those items are not working so well with these participants.
dcb:
Okay.
Thanks for confirming that.
I may well be back with more questions once we begin the actual analyses.
helenC July 30th, 2013, 12:39pm:
Dear Prof Liancre
I am sorry to keep bothering you...but this is (hopefully) my last query!
I have looked at DIF and used table 30.1 to look for significant DIF. I have read on the winsteps 'help' and other winsteps literature, that one should look at the size of the DIF AND if it is significant (t-test). I have a few contrasts which are quite high (>0.5 logits), but p values are large (i.e. not significant). Why would a contrast be large but not significant?
THank you again
Best wishes
Helen
Mike.Linacre:
Helen, "large but not significant" is like tossing a coin 3 times and seeing 3 heads. 3 heads is a large difference from the 1.5 heads we expect to see (we are talking statistics :-) ), but 3 heads is not significant because we expect to see 3 heads 12.5% of the time.
So, "large but not significant" = few observations, big difference
"small, but significant" = many, many observations, small difference
we want "large and significant" = enough observations so we can be sure, big enough difference so that the difference matters.
However, "large" is always worth investigating, because, even with only a few observations, it may indicate trouble. We may only see one airplane crash, among millions of flights, but, even though that event is not statistically significant, it matters a huge amount.
harmony July 22nd, 2013, 8:30am:
Hi all:
I want to clarify if the value of a logit is the same across different constructs. Just like a kg of apples is the same as a kg of gold in terms of weight, is it true that a logit of reading comprehension ability is the same as a logit of mathematical ability in terms of ability?
Cheers
Mike.Linacre:
Harmony, one day there will be universal measures, but today, a "reading" logit is like Fahrenheit, and a "math" logit is like Celsius. People have studied the relationship between logits of reading and math, https://www.rasch.org/rmt/rmt62f.htm, and also between math logits for different tests and in different testing situations, https://www.rasch.org/rmt/rmt32b.htm
But the good news is that for many tests and in many situations, one logit is approximately equal to one year of educational growth.
harmony:
Thanks for your reply Mike.
So, if we are examining how multiple variables affect something like reading ability, we can use Rasch to get those variables on their own interval scales, but need other statistical methods to figure out their relative significance?
Do you know of any attempts to equate logit values across different constructs?
Do you have any recommended readings on the quest for universal measures?
PS: I truly appreciate your replies, guidance, and dedication on this forum. I know of no other expert so willing to share his expertise! You are a rare and exceptional individual 8)
Mike.Linacre:
Harmony, Rasch measurement is approximately where thermometry was around 1650. Individual thermometers were linear enough for measuring particular types of heat, but there was no universality of units across thermometers, or across types of heat.
Jack Stenner and William P. Fisher, Jr., are leaders in the quest for generalization of measures and universality. They have many Research Notes in Rasch Measurement Transactions: www.rasch.org/rmt/contents.htm and many papers published elsewhere.
amrit July 26th, 2013, 10:02am:
I am just thinking about class interval. I am using RUMM 2030 and i want to know about the significance of class interval because i have 390 observations. And i donot know how many class interval should be there? I search in so many literature but i donot find the reliable answer.Next thing is if i make the difference in class intervla then fit on the model is also different.In my case i put 6 class interval and my model is fit.Can you suggest me about the significance of class interval?
I will wait for your response.
Kind Regards,
Amrita
Mike.Linacre:
Thank you for your questions, Amrita. Here are some of my own guidelines for selecting class intervals on a latent variable:
1) at least 10 subjects in each class interval. If there are less than 10, then one idiosyncratic subject in the class interval can influence results noticeably.
2) subjects at the means of the class intervals should be statistically significantly far apart. This distance is at least 3 times the standard error of the subject's measure. If the distance is less than this, then allocations of subjects to classes may be dominated by statistical accidents.
3) subjects at the means of the class intervals should be substantively far apart. In many applications of Rasch, this is at least one logit apart. If the distance is less than this, then the differences in performance between adjacent classes tend to be meaninglessly small.
However, as you have noticed, a problem with making fit decisions based on class intervals is that alternative reasonable classifications can produce noticeably different fit results. Under these circumstances, the class intervals producing the worst fit become the basis for our actions. Our aim in the fit analysis of empirical data is to mitigate the worst case. We can then be confident that our findings are robust against being "Fooled by Randomness". http://en.wikipedia.org/wiki/Fooled_by_Randomness
windy July 23rd, 2013, 3:21pm:
Hi Mike,
Can you please help me understand how the number of empirical bias terms is calculated in Table 9.4 of the Bias/Interaction report in Facets?
Thanks,
Stefanie
Mike.Linacre: Stefanie, suppose we have two facets selected for bias analysis, "B": items and ethnicities. Then Facets computes a bias size for every observed different combination of an item and an ethnicity. The maximum number of bias terms is (number of item elements) * (number of ethnicity elements). Empirically, not all these combinations may be observed, so the empirical number can be less.
windy: Thanks!
amrit July 24th, 2013, 8:23am:
From the paper "CAn neuropathetic screening tools be used as outcome measures" of Alan Tennant i found that no items had correlation greater than 0.3 so aabsence of local independency. In my result also i found none of the item residuals greater than 0.3 but i got some item residual less than -0.3 so can i conclude there is local independency?
I am using RUMM 2030.
Amrit
Mike.Linacre: Amrit: local dependency is not a threat to the validity of your analysis.
seol July 22nd, 2013, 2:59am:
Dear Dr. Linacre
Hello? I'm Seol ^^
When I try to dealing decimal data for particular item(for example, mean score) in Facet. What is the command? For example, for item 5, the data looks like 2.7, 5.6, 8.9 ranging from 0 to 10. but other items are integrals.
Thanks in advance
Sincerely
Seol
Mike.Linacre:
Seol, in Facets, every advancing score must mean one higher level of the latent variable. In your data, 0,1,2,3,4,5,6,7,8,9,10 are 11 levels of performance.
What does 2.7 mean? From the viewpoint of Facets it means:
an observation of 2 weighted 0.3 (= 0.6) + an observation of 3 weighted 0.7 (= 2.1 so that 0.6+2.1=2.7)
so, if the original Facets observation was:
facet1, facet2, facet3, 2.7
then the Facets data is:
Data=
R0.3, facet1, facet2, facet3, 2
R0.7, facet1, facet2, facet3, 3
Suggestion to Mike: Facets should be able to do this automatically!
Jessica July 19th, 2013, 3:23pm: Hi, everybody. I met a problem when I used Rasch dichotomous model to analyze one well-estbalished test (with 15 items). I found that its person reliability was very low (only .45), but the Cronbach's alpha was acceptable (at .75). The person-item map showed that the test was obviously too easy for my sample. I planned to use the person measures to study the predictive validity of the test, but now I am at a dilemma. Given its low perosn reliability, I just wonder whether I could still use its person measures. Wish somebody could give me some help or suggestions. (still a novice to Rasch. Please forgive me if my question sounds stupid)
Mike.Linacre:
Yes, we can help, Jessica. High Cronbach Reliability and low Rasch Reliability happens when there are many persons with extreme scores. Since the test is too easy for the sample, then there must be many people with maximum-possible or near-maximum-possible scores. A person with an extreme score has very high raw-score precision, but very low measurement precision. It is like measuring someone who is too tall for the tape measure. We are certain that person is taller than the tape measure (Cronbach Alpha), but we don't know how tall the person actually is (Rasch Reliability).
In this situation, the Rasch measures are more accurate than the raw scores because the raw scores have a strong ceiling effect. This ceiling effect is somewhat lessened by the Rasch measures. If you look at the relationship between raw scores and Rasch measures (Winsteps Table 20) you will see the ogival shape of the score-to-measure curve.
Jessica: Dear Dr. Linacre, thank you very much for your help and detailed explanation. I read carefully the part on reliability in the winsteps manual and some related threads posted here. I believe I basically understand what they mean, but my question still remains. May I conclude that If low person reliabilities (below .5) and low person separation index (below 1) indicate that the there is more error variance than person variance in the observed variance, then we should just drop the test for further analyses (like studying other aspects of its validity)? (as is my case)
Mike.Linacre:
Jessica, "drop the test" could be a premature decision. If we are making decisions for individuals, then tests with reliability below 0.5 are indecisive. However, if we are making decisions for groups, e.g., Predictive Validity, then this test could be decisive. International Surveys such as TIMSS and PISA are tests like that. They are bad at measuring individuals, but they are good at measuring nations. Also, the item hierarchy (item reliability) may be very strongly defined, so that Construct Validity and Content Validity can be verified.
Jessica: Dear Dr. Linacre, got it. Thank you very much!
annatopczewski July 17th, 2013, 5:19pm:
I am working with a set of items one of which is scored 0/2 while all others are scored 0/1. (The data file reflects this scoring and cannot be changed) When I run winsteps with the following in the following codes
NI=3
ITEM1=25
CODES="012"
models=r
groups=0
stkeep=n
stbias=n
pvalue=y
ptbis=y
udecim=5
and then look at the scfile, I notice that the scfile scores the 0/2 item as 0/1. However the pfile reflects the 0/2 scoring and the sfile has categories listed as 0 and 2.
I found when iweight= is used, the scfile then reflects the 0/2 scoring but the pfile then incorrectly scores the item as 0/4.
Is there anything that can be done to have the scfile reflect the 0/2 scoring of the item while not disrupt the 0/2 scoring that is done in the pfile or sfile?
Mike.Linacre:
Thank you for your question, Annatopczewski.
Winsteps has obeyed the specificiations:
CODES="012" -> the original data can be any of 0, 1 and 2
groups=0 -> each item has its own response structure
stkeep=n -> if any item only has observations of 0 and 2 then score them 0 and 1
Perhaps the test developers intended 0 and 2 to mean 0 (1) 2, but (1) is not observed. If so,
STKEEP=Yes
or
0,2 means 0,1 twice If so
STKEEP=No
IWEIGHT=*
(item number) 2
*
See www.rasch.org/rmt/rmt84p.htm
Here is a suggestion if you choose IWEIGHT=2
add a response string for every raw score to the data set, and PWEIGHT= them all with zero weight. Then you will have the measure and standard error for every score without changing anything in your original data.
Nettosky July 14th, 2013, 3:18pm: Hello! I have some theoretical questions "on the run". Let's say i am validating a well known outcome instrument on a specific population, and all fit statistics suggest that my test is unidimensional and can thus generate an overall score. Let's also say that in my analyses i notice that residuals strongly correlate for some items (in other words, some items are near replications), despite unidimensionality. Finally, if i adjust unidimensionality by creating testlets, the reliability (person separation index) of my questionnaire drops down considerably. What action do i take? Am i obliged to report local dependency although i have good fit statistics? Do i have to sacrifice reliability in order to fix local dependency? In summary, is it necessary to care about local dependency in all cases? Thanks in advance!
Mike.Linacre: Nettosky, you have encountered the "attenuation paradox" https://www.rasch.org/rmt/rmt64h.htm . If we have highly dependent items, the test reliability is artificially increased. In your example, the true reliability is the testlet reliability.
Nettosky: Thank you, that solves the problem. In any case, I am proceeding creating testlets with residual correlation above 0.5. Is there a rule of thumb for residual correlations? I have noticed that results vary a lot if i choose other "cut-offs" for residual correlations.
Mike.Linacre:
Nettosky, I have not heard of a "rule of thumb". ut I am concerned that "results vary a lot".
As we collapse dependent items into super-items or testlets, we expect the range of the person measures to reduce, but we also expect the correlation of the person measures across analyses to be close to 1.0. Is this happening for you?
Suggestion: since the person scores are staying constant, but the items are changing, set the person mean at zero (UPMEAN=0) instead of the conventional item mean at zero (UIMEAN=0).
Nettosky: Yes that is happening. Results vary in terms of PSI: if i add items with a residual correlation above 0.5 into testlets my PSI changes slightly. If i choose to "testletize" items that are correlated above 0.3 the PSI changes considerably.
markc2@live.com.au July 11th, 2013, 11:07am:
I have some queries regarding the article by Wolfe E.W. ōEquating and Item Banking with the Rasch Modelö presented as Ch 16 in Smith E.V. and Smith R.M. (2004). Introduction to Rasch Measurement, Maple Grove, Minnesota: JAM Press. The article is essentially a re-presentation of the authorÆs article of the same name from the Journal of Applied Measurement, 1(4) 2000, 409-434.
My questions and the associated equations are contained in the attached PDF.
Any clarifications would be welcome.
Thanks,
Mark C
Mike.Linacre:
Thank you for your questions, Mark.
Your PDF is highly technical. Please contact the author, Edward Wolfe. See https://ccsso.confex.com/ccsso/2010/webprogram/Person400.html
markc2@live.com.au: Thank you for the link, Mike. I will follow up with the author.
uve July 7th, 2013, 6:29pm:
Mike,
It seems that the usual requirement of raters is to fully understand the rubric against which the examinees will be judged and to use it consistently. If we have a perfect rater, then it seems there would be no need for additional raters. Even a realistic rater with some error would work in most of our K-12 public education endeavors. So with that said, what will be the need to have more than one rater in future administrations provided we have one excellent rater and that the items were initially very well calibrated by team of raters?
In California, we will be using the new Smarter Balanced Assessment Consortium's Common Core assessment system beginning in 2015. There will be many short response items. According to SBAC, the rubrics that were initially calibrated by a team of educators were then tested by comparing scores given by two raters and between a rater and the AI system that will be scoring these short response items. Agreement between the rater and AI was much closer than between the two human raters. This may work for the short response items, but there will be performance-based tasks that will likely only be scored by one teacher for his/her class without any AI involvement.
On the other hand, I've heard that having great variance in raters allows a broader range of measurement to take place.
So which is the preferred path: relying on one really good rater (needed often I imagine when time and resources are in short supply, like K-12), having several raters in "realistic" agreement, or having several raters who vary greatly in their interpretation and usage of the scale?
As always, I guess the answer lies in the application. But any guidelines you could provide would be most appreciated.
Mike.Linacre:
Uve, your "one rater" logic motivates G-Theory. There are many situations in which one rater is all that is required, for instance, in "rating" (counting) the number of children in a classroom. However, there are other situations in which rater variance is crucial, for instance, in school principals rating their teachers.
We never want raters who "vary greatly in their interpretation and usage of the scale". This is as disastrous to psychometrics as carpenters who "vary greatly in their interpretation and usage of the tape measure" would be to woodwork.
uve July 7th, 2013, 6:12pm:
Mike,
For a typical 3 Facets analysis having raters, ratees and items, do you recommend always setting all Facets to positive when running an interaction test (bias)? If not, what would be a typical exception?
Mike.Linacre: Uve, please choose the orientation for the facets, and for the bias terms, that makes most sense to your audience and you. If in doubt, use positive orientation because it is usually easier to think about and to explain.
windy July 5th, 2013, 6:57pm:
Dear Dr. Linacre (and others),
I have a question about the Outfit MSE statistics that are reported for rating scale categories in Facets.
In Optimizing Rating Scale Category Effectiveness (Linacre, 1999), these statistics are described as a method for diagnosing whether a "category has been used in unexpected contexts" (p. 97).
Is the Outfit for a category the total unweighteded mean square error summed across people in that category?
Thanks,
Stefanie
Mike.Linacre: Windy, The outfit for a category is the unweighted mean-square statistic (= usual chi-square statistic divided by its degrees of freedom) for the observations in the category. We are usually concerned when this value is greater than 1.5, and alarmed when it is greater than 2.0.
windy July 3rd, 2013, 5:06pm:
Hi Rasch-stars,
I am doing an analysis with some anchored items. When I run the file, all of the correct items seem to be anchored. However, an additional item (Item 3) is also being mysteriously anchored to 1.00 logits during the analysis.
I've specified the anchors using this code:
IAFILE= *
4 -.67742
10 1.28318
11 .53008
12 .56478
13 .82998
15 .62538
16 2.65328
19 .87548
34 2.41728
43 .69818
Any thoughts about why Item 3 is being anchored?
My entire specification file is attached as well.
Best,
Stefanie
Mike.Linacre:
Windy, a "*" is missing.
IAFILE= *
4 -.67742
10 1.28318
11 .53008
12 .56478
13 .82998
15 .62538
16 2.65328
19 .87548
34 2.41728
43 .69818
* ; there must be a final * to tell Winsteps where the list ends.
windy: Thanks!
| FORUM | Rasch Measurement Forum to discuss any Rasch-related topic |
| Coming Rasch-related Events | |
|---|---|
| May. 15 - June 12, 2026, Fri.-Fri. | On-line workshop: Rasch Measurement - Core Topics (E. Smith, Winsteps), www.statistics.com |
| June 19 - July 25, 2026, Fri.-Sat. | On-line workshop: Rasch Measurement - Further Topics (E. Smith, Winsteps), www.statistics.com |
| Aug. 31 - Sept 2 2026, Mon.-Wed. | In person: IMEKO TC1 Metrology Education and Training symposium, Klagenfurt, Austria www.photomet-edumet2026.com. Submissions by April 20 |
| Aug. 30 - Sept. 3, 2027, Mon.-Fri. | In Person: 2027 IMEKO World Congress (TC1, Tc7, TC13, TC18, TC26), Rimini, Italy imeko2027.org |