In order to obtain objective measurement for examinations that are graded by judges, an extension of the Rasch model designed to analyze examinations with more than two facets (items /examinees) is used. This extended Rasch model calibrates the elements of each facet of the examination (i.e., examinee performances, items, and judges) on a common logit-linear scale. A network for assigning judges to examinations is used to link all facets. Real examination data from the "clinical assessment" part of a certification examination are used to illustrate the application. A range of item difficulties and judge severities were found. Comparison of examinee raw scores with objective linear measures corrected for variations in judge severity shows that judge severity can have a substantial impact on a raw score. Correcting for judge severity improves the fairness of examinee measures and of the subsequent pass-fail decisions because the uncorrected raw scores favor examinee performances graded by lenient judges.
Introduction
To obtain a score or to make a pass-fail decision for an essay, oral, or clinical performance, a judge is required to assess the quality of the performance. The expectation is that the highest score will be awarded to the best performance regardless of which judge does the grading or which items are attempted. This expectation implies that unbiased scores which are independent of which judge does the grading can be obtained (Wright & Douglas, 1986) and that a particular performance will earn the same score irrespective of the judge (Andrich, 1973). But, as Thurstone (1927) observed, the discriminal process corresponding to a given stimulus always varies among individuals.
Most studies of judge reliability have found it to be less than perfect (i.e., Braun, 1988; Cohen, 1960). Numerous studies report significant variation among the scores awarded by different judges to the same performance (i.e., Littlefield, Harrington, Anthracite, & Garman, 1981). Although differences among judges are always found, a practical method to correct for those differences and their undesirable effect on the grading process has been unavailable. As a result, raw scores continue to be used as though they are comparable measures regardless of the varying characteristics of the judges.
Retraining has been the prevalent method of attempting to induce judges to make similar assessments of the same examinee performance. But judges employ unique perceptions which are not easily altered by training. We believe it will prove more manageable and more fair to correct examinee measures for variations in calibrated judge severity. This article presents (a) an extension of the Rasch model, which calibrates judges as well as items when estimating examinee measures, and (b) an application of the model to real examination data.
The extended version of the Rasch model (Andrich, 1988; Linacre, 1989) is designed to analyze data from examinations that have multiple (more than two) facets. The various facets of the examination are analyzed simultaneously but independently and calibrated onto one common loglinear scale. Each facet is composed of unique elements-sets of judges, items, tasks, and so on, according to the structure of the examination. All elements of all facets are positioned on the same common logit-linear scale so that a quantitative frame of reference for the examination is constructed and quantitative comparisons among and within facets and facet elements can be made.
Examinee performances are graded by judges using specified criteria and a grading scale. Examinee raw scores are influenced by variations in item difficulty and judge severity unless all judges grade all examinees on all items. When raw scores are used, a performance graded by a severe judge is less likely to pass than an equally good performance graded by a lenient judge. Thus, the particular judges grading a performance affect the raw score given.
The extended Rasch model calculates examinee measures that are independent of the variation in judge severity. As a result, the magnitude of judge severity impact on raw scores can be determined by comparing the raw scores with the corrected examinee measures. When judges do grade similarly, little difference is found between decisions based on raw scores and those based on corrected examinee measures. But, when judges vary in severity, raw scores are affected and decisions may be different.
Measurement for Examinations with Multiple Facets
Examinations that require judges to assess performances are usually part of a continuing measurement process. The results are intended to generalize across examinations and across samples of examinees. This generalization requires the construction and maintenance of a measurement system in which examinee measures are corrected for the local effects of judges and items. To accomplish this, the two-facet Rasch (G. Rasch, 1960/1980) model
loge (Pni / (1-Pni)) = (Bn - Di),
which separates the estimation of item difficulties (Di) and examinee measures (Bn) is extended to manage additional facets. Thus, the estimations of item difficulties can become sample-independent and estimation of examinee measures can become test-independent.
The extended Rasch model for four facets is:
loge( Pnijk / Pnij(k-1) ) = Bn - Di - Cj - Fk.
This model analyzes the facets: Bn for examinee performances, Di for items, Cj for judges, and Fk for the steps in the grading scale. Estimates, standard errors and fit statistics for examinee measures (Bn), item difficulties (Di), judge severities (Cj), and rating scale step difficulties (Fk) are produced.
The data are the scores given by the judges to the examinee performances. The item facet calibrates the items (i.e., essays, orals, clinical problems) of the test so that each item is characterized by a difficulty that is independent of the ability of the examinees to successfully perform the task or of the severities of the judges who grade it. The judge facet calibrates the judges who grade the performances so that each judge is characterized by a severity, which is independent of examinee ability or item difficulty. The examinee performance facet, in turn, measures the quality of examinee performance in a way that is independent of the distributions of item difficulty and judge severity. The resulting examinee measures are linear and also objective because they have been freed of the differences in estimated judge severity, which are necessarily part of the raw scores.
Judge severity is defined as the expectations or standards imposed by a judge when evaluating performances. Because each judge has a unique perception of his own standards, the task, and the profession, it is expected that levels of severity will differ.
The quantification of each facet in log-odds units (logits) locates the elements (items, judges, examinee performances) of each facet on a single common linear scale. Each facet is calibrated from the relevant observed performance scores, and all but the examinee facet are centered at a common origin, usually zero.
To be explicit, the log-odds for an examinee performance of ability Bn, receiving a grade k rather than a grade k-1 from a judge of severity Cj on an item of difficulty Di, is modeled as:
loge( Pnijk / Pnij(k-1) ) = Bn - Di - Cj - Fk. (1)
where:
Pnijk = probability of examinee n being graded k by Judge j on Item i
Pnij(k-1) = probability of examinee n being graded k-1 by Judge j on Item i
Bn = Performance Measure of examinee n
Di = Difficulty of Item i
Cj = Severity of Judge j
Fk = Difficulty of grading Step [category] k relative to Step [category] k-1.
Residual analysis and misfit statistics identify the particular gradings that are improbable, and thus provide a detailed check on the technical validity of the examinee measures.
Methods
Data
Real data from a certification examination are used to illustrate the variability of item difficulties and judge severities and the discrepancies between raw scores and objective examinee measures. To simplify this presentation, the step structure of the rating scale, Fk, is held constant across judges and not reported. This particular examination requires a series of "hands on" performances, each of which is assessed by a qualified judge. The psychometric techniques are applicable to essay (Linacre, 1987), oral (Lunz, Stahl, Wright, & Linacre, 1989), and any other examinations in which examinee performances must be evaluated by judges.
Two hundred and seventeen examinees submitted clinical examinations composed of fifteen histology slides. These slides are the items (Di) of the examination. Histology slides are small glass plates on which tissue specimens are mounted to be examined for cellular configuration with a microscope. Each slide had to be prepared according to specifications.
Eighteen judges graded these 217 clinical examinations. A 3-hr training session preceded the 2-day grading session. During training, the expectations for grading each slide were reviewed and the grading scale discussed at length. The 18 judges agreed on the criteria for three assessments of each slide. Tissue cutting and tissue processing scores ranged from unacceptable (0) to acceptable (1). Stain quality or coloring to distinguish cell characteristics ranged from poor/unacceptable (0) to above average (3). Thus, a maximum raw score of 5 points per slide was possible.
Because it is impossible for all 18 judges to grade all slides (217 x 15 = 3,255 slides), the 3,255 slides were allocated among the 18 judges. This allocation, however, means that slide scores are biased by the variation in judge severity. The way to remove this bias is to calibrate judge severity and remove it from examinee measures.
To enable this calibration of judge severity, each judge must grade each of the 15 slides sometime during the grading session and more than one judge must grade slides from each examination. A grading network is used to link all judges through common items and common examinations.
The grading network used to obtain the necessary links specified that judges be assigned to work stations and examinations be broken into three subsets of five slides each which rotated among work stations. Any particular judge graded only one of the three subsets of five slides from a given examination, whereas two other judges graded the other two subsets. The rotation pattern was arranged so that each judge had at least one examinee in common with each other judge.
Each judge was seated at one of three work stations with a microscope. Each work station of judges graded a designated subset of five slides (i.e., slides 1 to 5 or 6 to 10 or 11 to 15) during the first 2.5-hr session. In the next 2.5-hr session, each judge graded a different subset of slides from different examinations (i.e., slides 6 to 10 or 11 to 15) and so on. At the end, each judge had graded each of the 15 slides sometime during the 2 days and each examinee's raw scores came from three different judges, although no individual slide was graded more than once. This network not only provided the overlap necessary to calibrate judges, but also contains a check on internal validity because the subsets within each examination are graded independently by different judges. Variation among judges within a given examination are detected by the examinee fit statistics.
Analyses
Raw scores are calculated by summing the points awarded by the judges. A maximum of 75 points is possible (5 per slide = 1 for processing + 1 for tissue cutting + 3 for staining, for 15 slides). Raw scores awarded by severe judges are lower than raw scores awarded by lenient judges to comparable slides, giving a raw score advantage to examinee performances graded by lenient judges.
FACETS (Linacre, 1988), a computer program for Rasch analysis of data with multiple facets, was used to estimate objective measures from these data. The FACETS program calculates objective and conjointly additive (Luce & Tukey, 1964) measures, and also standard errors and fit statistics for each element of each facet in the data. In the course of these calculations, examinee raw scores are linearized and corrected for the severities of the three judges involved. This improves the validity of examinee measures because biases due to differences in severity of the particular judges involved are removed.
The fit statistics evaluate the suitability of the data for the construction of a variable and its measures (Wright & Masters, 1982, Chapter 5; Wright & Stone, 1979, Chapter 4). The fit statistics for judges indicate the degree to which each judge's gradings are consistent over items and examinations. Deviant grading patterns are flagged for review. Erratic judges are identified and the effect of their irregular grading on examinee measures can be evaluated. The fit statistics for slides indicate the degree to which the problem presented by the slide elicits consistent grading.
Two kinds of fit statistics are reported. The infit statistic is an information weighted mean-square residual difference between observed and expected, which focuses on the accumulation of central, inlying, deviations from expectation. The outfit statistic is the usual unweighted mean-square residual, which is particularly sensitive to outlying deviations from expectation (Wright & Masters, 1982, pp 99-101, 108-109). The expected value for these mean-squares is 1.0. Their asymptotic standard errors are approximately the square root of (2/d.f.), where d.f. is one less than the number of independent replications on which the mean-square is based. The region for acceptable fit used in this study was mean-squares greater than 0.6 and less than 1.5.
The elements in each facet are summarized by their measure mean, standard deviation, reliability of element separation, and corresponding chi-square for homogeneity (i.e., consistency with the hypothesis of no variance among elements). An important question is whether the elements of a facet are sufficiently dispersed along the variable to identify distinct levels and whether the substantive identification of these levels is in accordance with the intentions of those who constructed the examination.
In most test situations, significant variation in item difficulty and examinee performance is expected. When all examinees attempt all items, variations in item difficulties need not produce unfair raw scores as long as comparisons are kept within this sample of examinees and are understood to be ordinal rather than interval. But variation in judge severity, when examinee performances are graded by different judges, is not commensurate with the usual assumption that the raw scores are fair or objective. The reliability of element (i.e., judge, item, or examinee) separation specifies the proportion of observed variance not due to estimation error. This statistic, which is similar to the KR-20, indicates the extent of useful variations among the difficulties of items, the measures of the examinees, and the severities of the judges (Wright & Masters, 1982, pp 91-94, 105-106, 111-114).
RESULTS
|
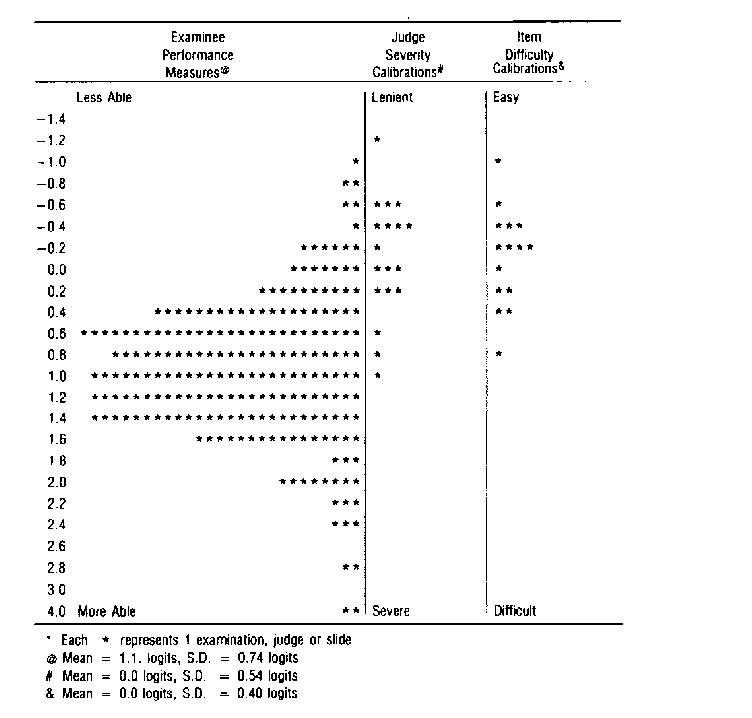
| FIGURE 1 Examination facets summary. |
|---|
Figure 1 maps the elements of the three facets of this examination on the common loge odds scale. The relative positions of examinee measures below the item calibrations show that these items were easy for most of these examinees. The judges cluster into four groups. One judge, at the top of Figure 1, is rather lenient; three judges, at the bottom, are rather severe. The other 14 form two clusters in between.
| TABLE 1 Judge Severity Facet | ||||
|---|---|---|---|---|
| Judge Number | Severity Calibration (Cj) Logits | SE Logits | Infit* MnSq | Outfit* MnSq |
| 10 14 8 15 1 13 9 3 16 6 7 4 11 18 2 12 5 17 |
1.08 0.90 0.71 0.34 0.28 0.24 0.16 0.09 0.07 -0.02 -0.23 -0.25 -0.31 -0.32 -0.48 -0.52 -0.54 -1.19 |
.20 .19 .07 .07 .15 .07 .08 .14 .07 .08 .07 .09 .07 .08 .15 .09 .10 .24 |
0.8 0.6 0.9 1.2 1.0 0.8 1.0 1.2 1.0 1.1 1.1 1.0 1.2 1.2 1.1 1.0 1.1 1.3 |
0.9 0.7 0.9 1.1 1.1 0.9 1.0 1.1 0.9 0.9 0.9 0.8 1.0 1.1 1.1 1.2 1.0 0.9 |
| MEAN SD | 0.00 0.54 | .11 .05 | 1.0 0.2 | 1.0 0.1 |
| Notes. RMSE = 0.12, Adj SD = 0.53, judge separation = 4.30, reliability of judge separation = .95. Equal judge severity chi-square = 347.7, df = 17, significance < .0001. * Expected values of infits and outfits are 1.0 with error 0.1. | ||||
Table 1 reports judge severity calibrations (Cj), their errors, infit and outfit statistics, and the summary statistics for the judge facet. Judge 17 at -1.19 logits (SE = 0.24) is the most lenient, and Judge 10 at 1.08 logits (SE = 0.20) is the most severe.
The usual working assumption when raw scores are used is that all judges grade at similar levels of severity so that differences among judges are immaterial. This assumes minimal variation among judge severities. In these data, however, the error-corrected standard deviation (SD) of the judges (judge separation) is 4.30 times the root mean-square estimation error. The reliability of this judge separation is 0.95, which is significantly greater than the zero that would be expected were these judges not discernibly different in their severity. Finally, the corresponding chi-square of 348 with 17 d.f. for judge equivalence also indicates vastly significant differences among judges. Thus, substantial and significant variation in judge severity has occurred despite thorough training in the use of the grading scale and verbal agreement on the criteria for assessing each slide.
The infit and outfit mean-squares document intrajudge consistency across items and examinee performances. Judge 14 shows the greatest tendency toward over consistency (infit = 0.6 and outfit = 0.7). Further analysis revealed that this judge used only 2 of the 4 points on the stain grading scale. Judge 17 with an infit of 1.3 verged on inconsistency but manifested no outstanding aberrant scores. Overall, these judges demonstrated sufficient intrajudge consistency when grading examinee performances (infit = .6 to 1.3; outfit = .7 to 1.2) to provide useful measures. Their fit statistics confirmed the internal validity of their scores.
| TABLE 2 Itema Difficulty Facet | ||||
|---|---|---|---|---|
| Slide Number | Difficulty Calibration (Di) Logits | SE Logits | Infitb MnSq | Outfitb MnSq |
| Difficult
7 13 5 3 2 11 4 6 1 9 10 8 12 15 Easy 14 | .85 .45 .41 .39 .29 .15 -.04 -. 12 -.13 -.19 -.24 -31 -.32 -.57 -.62 | .07 .07 .08 .08 .08 .08 .08 .08 .08 .08 .09 .09 .09 .09 .10 | 1.0 1.1 1.1 1.0 1.1 1.3 1.0 1.0 0.9 0.9 0.8 0.9 1.2 1.1 1.1 | 1.0 0.9 1.1 1.2 1.3 1.3 0.9 0.9 0.9 0.8 0.8 1.1 0.9 0.8 0.8 |
| MEAN SD | .00 .40 | .08 .01 | 1.0 0.1 | 1.0 0.2 |
| Notes. RMSE = 0.08, Adj SD = 0.39, slide separation = 4.71, reliability of slide separation _ .96. Equal slide difficulty chi-square = 369.8, df = 14, significance < .0001. a Items in this examination are 15 histology slides. b Expected values for infits and outfits are 1.0 with error 0.1. | ||||
Table 2 reports slide (item) difficulty calibrations (Di), their measurement errors, infit and outfit statistics, and the summary statistics for the item facet. Slide 7 at 0.85 logits (SE = 0.07) is the most difficult, whereas Slide 14 at -0.62 logits (SE = 0.10) is the easiest. The reliability of slide separation is 0.96 and the corresponding chi-square of 369 with 14 d.f. for slide equivalence indicates significant differences in difficulty among slides. This confirms that there is significant variation among slide difficulties beyond that due to estimation error. The construct validity of the observed ordering of the slides was confirmed through subsequent discussions with the panel of experts.
The infit statistics document that these slides were graded consistently by these judges. The outfit statistics show that these slides elicited few unexpectedly severe or lenient grades. Slide 11 with infit and outfit at 1.3 is the only slide verging on inconsistency. Analysis of the data for this slide showed that its particular characteristics induced some judges to grade the stain quality dichotomously at either 0 or 3. The resulting excess of unexpectedly high grades of 3 caused the high infit of 1.3. A few unexpectedly low grades of 0 awarded to otherwise above average performances caused its high outfit of 1.3. Generally, however, the data from these slides fit the model well enough to function as useful items for measuring examinee ability.
Observed raw scores ranged from 36 to 74 (75 is a perfect raw score). The mean raw score was 59 with a standard deviation of 7 points. Examinee measures ranged from 4.12 to -0.86 logits. The mean was 1.1 and the standard deviation was 0.74 logits. A chi-square test indicated that the distribution of examinee measures was not significantly different from normal. The correlation between raw scores and examinee measures was 0.91. This high correlation, however, does not eliminate the possibility that some raw scores were biased by variations in judge severity.
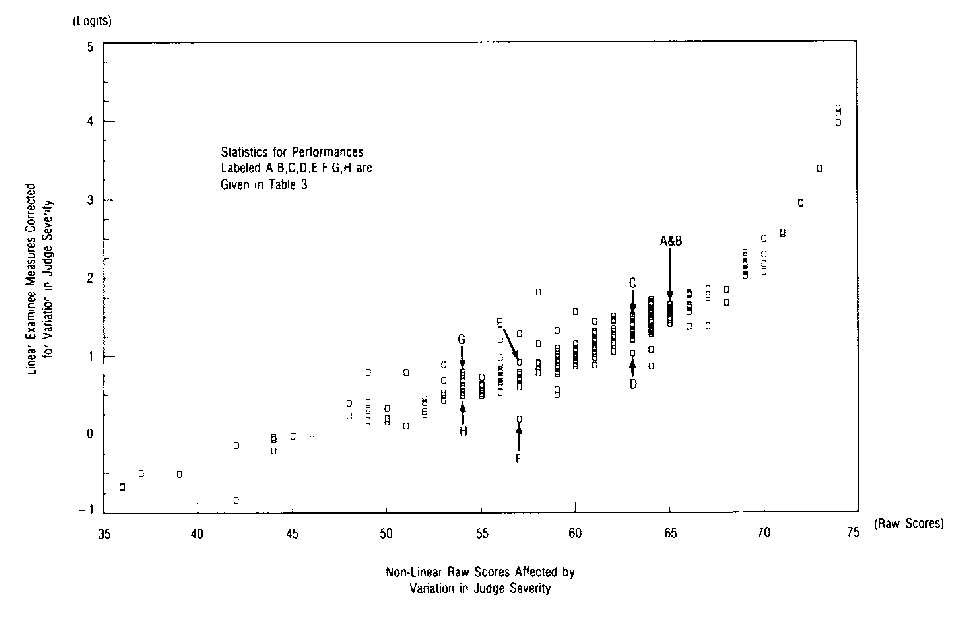 |
| FIGURE 2 Comparison of raw scores and logit examinee measures. |
|---|
Figure 2 plots the raw scores (which are not corrected for variations in judge severity) against their concomitant logit examinee measures (which are corrected). Figure 2 shows that examinations measured at 1.0 logits, and thus estimated to be equivalent in competence, received raw scores ranging from a low of 56 to a high of 64 depending on the severity of the judges who happened to grade these examinations.
| TABLE 3 Comparison of Examinee Measures Corrected for Judge Severity and Uncorrected Raw Scores | |||||||||
|---|---|---|---|---|---|---|---|---|---|
| Performancea | Judge Number Judge Severityb |
Judge's Mean Severity |
Examinee Performance |
Raw Score |
Judge Grading Consistency | ||||
| 1st | 2nd | 3rd | Measure | S.E. | Infitd | Outfitd | |||
| A | 7 -.23 | 15 .34 | 16 .07 | 0.06 | 1.79 | .37 | 66 | 1.0 | 0.9 |
| B | 13 -.24 | 16 .07 | 4 -.25 | 0.02 | 1.78 | .37 | 66 | 1.5 | 0.9 |
| Difference | 0.04 | 0.01 | .52c | ||||||
| C | 7 -.23 | 8 .71 | 6 -.02 | 0.15 | 1.67 | .34 | 64 | 0.8 | 0.9 |
| D | 2 -.48 | 17 -1.19 | 11 -.31 | -0.67 | 0.85 | .34 | 64 | 1.0 | 0.9 |
| Difference | 0.82 | 0.82 | .48c | ||||||
| E | 7 -.23 | 9 .16 | 6 -.02 | -0.03 | 0.77 | .29 | 57 | 1.0 | 0.9 |
| F | 17 -1.19 | 7 -.23 | 12 -.52 | -0.65 | 0.17 | .29 | 57 | 1.0 | 0.9 |
| Difference | 0.62 | 0.60 | .41c | ||||||
| G | 16 .07 | 7 -.23 | 8 .71 | 0.18 | 0.77 | .27 | 54 | 1.0 | 0.9 |
| H | 5 -.54 | 13 .24 | 6 -.02 | -0.11 | 0.47 | .27 | 54 | 0.9 | 0.9 |
| Difference | 0.29 | 0.30 | .38c | ||||||
| a The positions of these eight performances in Figure 2 are labeled. b Severity for each of these judges is reported in Table 1; 1st judge graded slides 1-5, 2nd judge graded slides 6-10, 3rd judge graded slides 11-15. Negative logit measures identify more lenient judges, positive logit measures identify more severe judges. c Standard error of the difference in examinee measures sqrt(S12 + S22 ). d Expected values of infits and outfits are 1.0 with error 0.2 to 0.3. | |||||||||
Table 3 shows how judge severity effects raw scores for the eight examinee performances labeled A, B, C, D, E, F, G, and H in Figure 2. Performances A and B earned the same raw score of 66 and comparable logit measures of 1.79 and 1.78 logits. Although they are graded by different judges, their judges are similar in average severity (.06 and .02).
The judges for Performance A (infit = 1.0), however, are more consistent in their assessments than the judges for Performance B (infit = 1.50). The high infit of Performance B draws attention to the presence of some unexpected grades in the record of this examinee performance. In this case, Performance B was awarded an unexpectedly low grade of 0 on slide 7 by Judge 16, whereas the staining grades awarded for the other slides were 2 or 3.
Performances C and D also earn the same raw score of 64. But their examinee measures are 1.67 and 0.85 logits with standard errors of 0.34. This substantial difference in the measures of 0.82 logits (nearly twice the standard error of either measure) is because the average severities of their judges are substantially different (.15 compared to -.67). This difference in judge severities lowers the raw score of Performance C and raises the raw score of Performance D to make them appear equivalent. The examinee measures, which are corrected for these differences in judge severities, show Performance C to be substantially more able than Performance D. Performances E and F, and G and H demonstrate similar patterns.
The fit statistics in Tables 1 and 3 show that the judges used the grading scale consistently and maintained their personal levels of severity across slides and examinations. These judges do, however, differ significantly in their levels of severity. These data and their analysis document the need and also the opportunity to correct for differences in judge severity in order to achieve objectivity and fairness.
DISCUSSION
The aim of the grading process is to differentiate among examinee performances while generalizing across the variations in other facets such as items and judges (Allal, 1988). Whenever different judges grade different examinee performances, the individual severities of the judges who grade the performance is introduced. The interpretation of the raw scores then depends on the severities of those judges. Even with explicit grading criteria and careful training, the best judges usually differ.
An adjustment for judge severity could be attempted by an analysis of variance (ANOVA) of the raw scores (Cronbach, Gleser, Nanda, & Rajaratnam, 1972). But the incomplete data (every judge does not grade every examination) and the nonlinearity of the raw scores (they are confined to a finite number of ordered response categories whereas the measures they are meant to imply are not) disqualify this approach.
The methods presented in this article show how to use a stochastic logit-linear measurement model to develop linear and objective measures of judge severity, item difficulty, and examinee ability from the nonlinear raw scores. This extension of the Rasch model has a structure resembling the ANOVA but its stochastic log-linear form produces linear estimates that are not affected by the missing data.
The Rasch analysis enables us to separate the estimates of judge severity and examinee ability (as well as item difficulty) so that each set of estimates is independent of the distributions of the other. As a result, the logit examinee measures are corrected for variation in judge severity (and item difficulty). This adjustment reduces the danger that qualified examinees will fail due to unlucky encounters with severe judges or that unqualified examinees will pass due to lucky encounters with lenient judges.
The Rasch model provides a standard error for each measure and also fit statistics which enable us to monitor the internal consistency of the data. The overall performance of each judge can be reviewed to see how consistently his particular level of severity is applied (Table 1). Each examinee measure can be evaluated to determine the extent to which the particular judges who graded this performance did so consistently (Table 3).
This study demonstrates that items and judges can be calibrated to define a common linear variable and that examinee measures on this variable can be corrected for variation in judge severity. The example illustrates that data from examinations which require judges can fit the expectations of the Rasch model well enough to construct a useful variable. The internal validity of the variable can be confirmed by analyzing the fit of the data to the measurement model expectations. Poorly fitting items can be identified and deleted. Poorly fitting judges can be identified for retraining or excused from the grading process. Examinee performances that have been unfairly graded can be identified by the consequent misfit. Many studies have found substantial variation among judges. This study demonstrates that correction for variation in judge severity is possible and practical.
It is common practice to act as though raw scores from different judges are comparable. But variation in judge severity and idiosyncratic judge-examinee interactions have always contaminated the raw scores used for pass-fail decisions. These threats to fair decisions have been neglected because no one knew what to do about them. Now it is no longer necessary to remain blind to these dangers or helpless to deal with them. The danger that an unfair pass-fail decision might follow from uncorrected raw scores is avoided by removing judge severity variation from the examinee measures. The danger that a particular judge might be miscalibrated for a particular examinee due to that judge's erratic behavior while grading that performance is guarded against by analyzing the various fit statistics. The judge infit and outfit statistics detect general irregularity in the judge's overall behavior (intra-judge consistency). The examinee fit statistics detect judge irregularities specific to the examinee, an interjudge consistency evaluation. Reviewing the particular improbable response residuals involved identifies the source and nature of the inconsistency.
One limitation on the use of the extended Rasch model is the data collection network it requires. The allocation of judges to items and examinations must produce a network of links complete enough to connect all of the judges through common items and common examinations. The calibration of items and judges is improved when the network has every judge grade every item and every examination somewhere in the design. The capacity to bridge missing data whenever necessary makes a network economical and efficient in time and effort. In this example, the network completes all necessary links without requiring any slide to be graded more than once.
Another possible limitation is that whereas judges are expected to be substantially different in their levels of severity, they are also expected to be consistent within those levels. Our series of studies confirm that this can occur (Lunz, Wright, Stahl, & Linacre, 1989). In addition, long experience showing that training seldom alters judge behavior implies that judges tend to maintain their levels of severity.
The advantage of the extended Rasch model is that it provides a frame of reference for quantifying all elements of the examination. In addition, the model produces measures that we have found can maintain their quantitative status beyond the local data analysis. This is especially important in certification, because a board usually has only one opportunity to assess an examinee but its decisions are meant to generalize beyond that particular point in time or those particular judges who do the grading.
Examinees who submit essay, clinical, or other performances expect to have them graded and measured objectively. Because judges cannot be made to grade identically, the alternative is to apply a measurement system that observes, measures, and corrects for judge differences. Examinee measures can be estimated with a high degree of objectivity when the variation in the sampling of items and judges is acknowledged and accounted for in the calculation.
The management of examinations with multiple facets is vastly improved when all facets of the examination are observed and analyzed. Calibrated pools of items and judges can be constructed and maintained. Examinations can be equated through item and judge banks so that fixed, rational standards can be established and maintained. The bank difficulties of items can be used to better target examinations. Misfitting items and judges can be identified so that revision and retraining can be undertaken. This promotes a new level of objectivity for examinations that require judges and, thereby, provides more equitable and meaningful assessments of examinee performance.
Mary E. Lunz, Benjamin D. Wright and John M. Linacre.
ACKNOWLEDGMENT
We thank Barbara M. Clancy and John A. Stahl, Ph.D., for their invaluable assistance to this research project.
REFERENCES
Allal, L. (1988). Generalizability theory. In J. P. Keeves (Ed.), Educational research, methodology and measurement: An international handbook (pp. 272-276). New York: Pergamon.
Andrich, D. (1973). Latent trait psychometric theory in the measurement and evaluation of essay writing ability. Chicago: University of Chicago Library.
Andrich, D. (1988). A general form of Rasch's extended logistic model for partial credit scoring. Applied Measurement in Education, 4, 363-378.
Braun, H. I. (1988). Understanding scoring reliability: Experiments in calibrating essay readers. Journal of Educational Statistics, 13, 1-18.
Cohen, J. (1960). A coefficient of agreement for nominal scales. Educational and Psychological Measurement, 20, 37-46.
Cronbach, L. J., Gleser, G. C., Nanda, H., & Rajaratnam, N. (1972). The dependability of behavioral measurements: Theory of generalizability for scores and profiles. New York: Wiley.
Linacre, J. M. (1987, June). The calibration of essay graders. Paper presented at the Midwest Objective Measurement Seminar, Chicago.
Linacre, J. M. (1988). FACETS. Chicago: MESA Press.
Linacre, J. M. (1989). Many-facet Rasch measurement. Chicago: MESA Press.
Littlefield, J. H., Harrington, J. T., Anthracite, N. E., & Garman, R. E. (1981). A description and four-year analysis of a clinical clerkship evaluation system. Journal of Medical Education, 56, 334-340.
Luce, K. D., & Tukey, J. W. (1964). Simultaneous conjoint measurement, a new type of fundamental measurement. Journal of Mathematical Psychology, 1, 1-27.
Lunz, M. E., Stahl, J. A., Wright, B. D., & Linacre, J. M. (1989, March). Variation among examiners and protocols on oral examinations. Paper presented at the annual meeting of the American Educational Research Association, San Francisco. (ERIC Document Reproduction Service No. TM 012988)
Lunz, M. E., Wright, B. D., Stahl, J. A., & Linacre, J. M. (1989, March). Equating practical examinations. Paper presented at the annual meeting of the National Council on Measurement in Education, San Francisco. (ERIC Document Reproduction Service No. TM 012968)
Rasch, G. (1960/1980). Probabilistic models for some intelligence and attainment tests. Chicago: University of Chicago Press.
Thurstone, L. L. (1927). A law of comparative judgment. Psychological Review, 34, 273-286.
Wright, B. D., & Douglas, G. A. (1986). The rating scale model for objective measurement (Memorandum No. 35). MESA Psychometric Lab. Chicago: MESA Press.
Wright, B. D., & Masters, G. N. (1982). Rating scale analysis. Chicago: MESA Press.
Wright, B. D., & Stone, M. H. (1979). Best test design. Chicago: MESA Press.
This research memorandum was published as: Lunz, M.E., Wright, B.D., Linacre, J.M. (1990) Measuring the Impact of Judge Severity on Examination Scores. Applied Measurement in Education, 3(4), 331-345.
Go to Top of Page
Go to Institute for Objective Measurement Page
| FORUM | Rasch Measurement Forum to discuss any Rasch-related topic |
| Coming Rasch-related Events | |
|---|---|
| Jan. 16 - Feb. 13, 2025, Fri.-Fri. | On-line workshop: Rasch Measurement - Core Topics (E. Smith, Winsteps), www.statistics.com |
| Apr. 8 - Apr. 11, 2026, Wed.-Sat. | National Council for Measurement in Education - Los Angeles, CA, ncme.org/events/2026-annual-meeting |
| Apr. 8 - Apr. 12, 2026, Wed.-Sun. | American Educational Research Association - Los Angeles, CA, www.aera.net/AERA2026 |
| May. 15 - June 12, 2026, Fri.-Fri. | On-line workshop: Rasch Measurement - Core Topics (E. Smith, Winsteps), www.statistics.com |
| June 19 - July 25, 2026, Fri.-Sat. | On-line workshop: Rasch Measurement - Further Topics (E. Smith, Winsteps), www.statistics.com |
Our current URL is www.rasch.org
The URL of this page is www.rasch.org/memo47.htm