Using the Linear Logistic Test Model to
Investigate a Discourse-based Model of Reading Comprehension
S. L. Latimer
Royal Australian Navy
This study applies the Linear Logistic Test Model
(LLTM) to examine the validity of a reading mechanism proposed by
Kintsch. This mechanism is based on individual cognitive operations
and semantic structures in the reading material. The LLTM analysis
indicated that the assumed cognitive operations by which readers
establish a coherent representation of semantic structure accounted
for most of the variation in the processing difficulty of the
experimental materials. It was concluded that with added
constraints, Kintsch's model may provide a useful simulation of the
comprehension process and, further, that the LLTM is a valuable
investigative tool in this area.
INTRODUCTION
The comprehension and memorization of prose is a problem which
has recently become a major concern in psychology. Before the
1970s, cognitive psychologists confined their interest to the
processing and memorization of unrelated words and sentences.
Research into the comprehension of connected discourse was the
domain of the educators. However, the early 1970s brought the
development of text grammars in linguistics and of artificial
intelligence models in computer science. Both provided an impetus
for psychologists to return to this area of human experience and
several theories about the comprehension and memorization of prose
have been developed.
Amongst the theorists who emphasize the semantic and pragmatic
aspects of the comprehension process are those who argue that a
complete understanding of this problem requires some scheme by
which the semantic structure of the text is analyzed. Some of these
writers are concerned with meaning at the individual idea or
microstructure level (viz., Crothers, 1972; Frederiksen, 1972,
1975a, 1975b, 1975c; Kintsch, 1974; Meyer, 1975) while others deal
with the global organization or macrostructure of prose (viz.,
Rumelhart, 1975; Thorndyke, 1977).
However, these text-structure theorists do not attempt to
describe the cognitive mechanisms by which prose is parsed and
organized in memory. Consequently, their models can be no more than
descriptive.
In contrast, a model which does emphasize the cognitive
processes involved in comprehension has been developed by Kintsch
and Van Dijk (1978). They build upon their earlier work with
microstructure (Kintsch, 1974) and macrostructure (van Dijk, 1977;
van Dijk and Kintsch, 1977), their stated aim being 'to describe
the system of mental operations that underlie the processes
occurring in text comprehension and in the production of recall and
summarization protocols' (Kintsch and van Dijk, 1978: 363). Three
sets of cognitive operations are specified: one organizes the
meaning elements into a coherent whole; another condenses the full
meaning into the gist; and the third generates new text from the
stored representation resulting from the comprehension process.
The purpose here is to investigate the validity of this
description. To examine all of the processing assumptions, however,
would be impracticable. Therefore, only the coherence mechanism by
which the meaning units expressed in the semantic structure are
processed and organized in memory is our concern. This component is
easily isolated from the total comprehension process; further, in
being the first stage of that process, it is a logical starting
point.
The wider study from which this paper originates investigated
the degree to which comprehensibility is 'the result of the
interaction between a particular text (with its text
characteristics) and particular readers (with their
information-processing characteristics) ' (Kintsch and Vipond,
1979: 362). The substantive hypothesis was that the difference
between better and poorer readers on measures of reading time and
reading comprehension tasks, when administered a relatively
incoherent text, will be greater than the difference between these
reader types when administered a relatively coherent text. An
additional test of the proposed reading mechanisms in relation to
the relative coherence of texts was also conducted using the Linear
Logistic Test Model (LLTM) and it is this analysis which is of
interest here.
Before proceeding to an account of the LLTM and its application,
it is necessary first to provide a brief description of Kintsch's
coherence mechanism.
THE COHERENCE MECHANISM
The elements of Kintsch's analysis are word concepts which are
essentially 'lexical entries expressed linguistically through a
word' (Kintsch, 1974: 12). Propositions `are n-tuples of word
concepts, one of which serves as a predicator and the other as
arguments' (Kintsch, 1974: 12). Predicates or relations are
normally expressed in English as verbs, adjectives or conjunctions,
whereas arguments are usually expressed by nouns. To illustrate,
consider (1) below:
|
Mary bakes a cake. (BAKE, MARY, CAKE)
| (1) |
The sentence is represented by the proposition enclosed in the
parentheses within which the predicate is always written first
followed by one or more arguments. Note that the word concepts are
denoted by words in capital letters and all the terms are separated
by commas.
Propositions do not normally stand alone. Instead, they stand in
relation to each other and so form a text base. Within this text
base or ordered list of propositions, a particular word concept may
be an argument in more than one proposition. In this situation, the
proposition containing the repeated argument is 'said to be
subordinated to the proposition where the argument originally
appeared', (Kintsch, 1974: 16). These subordination relationships
constitute the hierarchical structure of text which can be
represented graphically. Table I exemplifies a formal
representation of such a structure.
TABLE I
ENGLISH BUCCANEERS PASSAGE - LOW COHERENCE VERSION TEXT
ENGLISH BUCCANEERS |
|---|
|
The eighteenth century was very rich in voyages of exploration. One
of the reasons for this was because the English buccaneers made a
number of remarkable voyages round the world at the beginning of
the eighteenth century. Spanish ships were captured and Spanish
towns were held up to ransom. Men adventured into the Pacific,
which most of them reached by sailing round Cape Horn, in search of
these. After spending a year or eighteen months on the west coast
of South America, the buccaneers returned to England across the
Pacific and Indian Oceans and round the Cape of Good
Hope. |
| TEXT BASE |
COHERENCE GRAPH |
1
2
3
4
5
6
7
8
9
10
11
12
13
14
15
16
17
18
19
20
21
22
23
24
25
26
27
28
29
30
31
32
33
34
35
36
37 |
(ENGLISH, BUCCANEERS)
(WAS, 18TH CENTURY, RICH)
(VERY, RICH)
(IN, 2, VOYAGES)
(OF, VOYAGES, EXPLORATION)
(ONE OF, REASONS)
(REASONS, 2)
(BECAUSE, 9, 7)
(MADE, 1, VOYAGES)
(NUMBER, VOYAGES)
(REMARKABLE, VOYAGES)
(LOC: ROUND, VOYAGES)
(TIME: AT, VOYAGES, 18TH CENTURY)
(BEGINNING, 18TH CENTURY)
(SPANISH, SHIPS)
(WERE, 15, CAPTURED)
(AND, SHIPS, TOWNS)
(SPANISH, TOWNS)
(HELD UP, 18, RANSOM)
(ADVENTURED, MEN)
(LOC: INTO, 20, PACIFIC)
(MOST, MEN)
(REACHED, 22, PACIFIC)
(BY, 23, 25)
(ROUND, SAILING, CAPE HORN)
(IN SEARCH, 20, 17)
(TIME: AFTER, 28)
(SPEND, BUCCANEERS, 29)
(OR, YEAR, EIGHTEEN MONTHS)
(LOC: ON, 28, COAST)
(WEST, COAST)
(OF, COAST, SOUTH AMERICA)
(RETURNED, BUCCANEERS, ENGLAND)
(ACROSS, 33, OCEANS)
(PACIFIC, OCEAN)
(INDIAN, OCEAN)
(ROUND, 33, CAPE OF GOOD HOPE) |
|
Argument repetition is important in text coherence, because it
relates new information to information already processed. Kintsch
(1978: 59) suggests that a connection among the propositions of the
text base is established when all of the propositions have one or
more arguments in common with at least one other proposition. This
connection `is not a sufficient condition for the coherence of a
text base, but it is a necessary condition' (Kintsch, 1978:
59).
The critical assumption in Kintsch's coherence mechanism is that
the reader attempts to represent the text in memory by a single
network in which the propositions are organized hierarchically. As
outlined in Kintsch and Vipond (1979: 344-54), a number of
assumptions are made concerning the cognitive operations by which
this representation is constructed.
The first of these is that, because of capacity limitations, a
reader establishes this memorial representation in cycles. That is,
the reader processes a portion of the text base, connects it to a
growing graph and continues on to the next section. The number of
propositions processed in each cycle is in part determined by the
text through the sentence and phrase boundaries. However, the size
of this input set is also a reader characteristic which limits the
number of propositions that are worked in parallel. This number
will be denoted by `n'. Because it is also assumed that individuals
differ in their short-term or working memory capacity, the size of
`n' will vary among readers.
The second processing assumption is that a reader will attempt
to maintain coherence between successive input sets by selecting a
subgraph from each cycle. Then this subgraph is retained in
short-term memory (STM) and connected through argument repetition
to the new incoming section of the text base. Those propositions
contained in the input set which are not selected and retained in
STM are stored in long-term memory (LTM). This subgraph or STM set,
being part of working memory, is seen as some kind of STM memory
buffer. The size of this buffer will be denoted by `s'. It is
argued that this buffer capacity is a source of individual
differences in reading comprehension.
Given that memory limitations prevent the entire graph being
carried along in STM, the next model assumption specifies which
propositions in the cycle are retained in the buffer. Kintsch
intuitively suggests a selection strategy which favors the most
important as well as the most recent propositions. This he calls
the 'leading-edge rule'.
The fourth assumption is that if no connection is found between
the input set and the STM set, a search of LTM is made in order to
determine if a proposition already stored can provide the necessary
connection between the new information and the existing network. If
such a proposition is located in LTM then it is reinstated in
working memory; when a number of connective propositions are
available, only the most recent is reinstated. If an overlap
proposition however cannot be found, then the reader must infer as
many additional propositions as required to provide a
connection.
Even if the text base is processed in a number of connected
subgraphs, the resulting structure may differ from the `ideal'
coherence graph which is constructed as if readers have no memory
limitations. For example, a proposition (and the whole subgraph
subordinated to it) may be annexed to a proposition far down in the
graph during processing, but when the whole graph becomes
available, a connection to a higher level proposition is found. As
a result the reader is assumed to reorganize his/her memory
representation so that it becomes more like the `ideal'
network.
In summary, the model characterizes the difficulty by which text
is comprehended in terms of the number of cycles, reinstatements,
inferences, and reorganizations required to construct the `ideal'
network in memory. The demand placed on these microprocessors is
not only a function of the coherence of the text base but further
depends on the working memory capacity of the reader.
THE LINEAR LOGISTIC TEST MODEL
The LLTM is a generalization of the Rasch's simple logistic
model (SLM) for responses to dichotomously scored test items
(Rasch, 1966). One form of this model, which indicates the
probability of a correct response is given by:
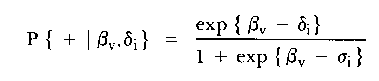
| (2) |
where βv = ability parameter of subject v, v =
1, 2_ . ., n,
δi = difficulty parameter of item i, i = 1, 2, .
. ., k, and
+ = a correct response.
That is, according to the SLM, the probability that subject v
solves item i correctly is a logistic function of
βv, which characterizes the ability of the subject,
and δi, which characterize the difficulty of the
item. These two parameters can be estimated using conditional
maximum likelihood (CMLE) procedures.
The LLTM, developed by Fischer (1973, 1976, 1977) and Spada
(1977), extends the basic Rasch model to incorporate assumptions
about the cognitive operations involved in solving items. In
particular, it assumes that the item difficulty is itself `a linear
function of the number and difficulty of the necessary operations'
(Spada, 1977: 241). This linear combination is presented in
(3):
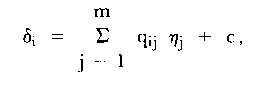
| (3) |
where ηj = basic parameters attached to the
cognitive operation j,
qij = weight of operation j in item i (e.g., the
hypothetical frequency with which operation j is needed in item i),
and
c = a normalizing constant.
Substituting (3) into (2) gives the usual characterization of
the LLTM:
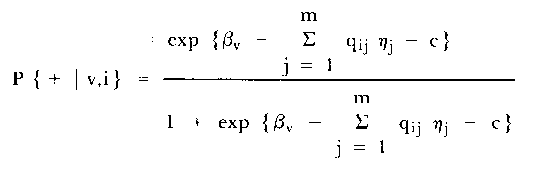
| (4) |
The basic parameters ηj can be estimated again
using CMLE methods.
The validity of the LLTM, and hence of the hypothesized
cognitive operations or task structures, can be tested by comparing
the basic SLM estimates of the item difficulties
(δi) with those (δi*)
recovered from the CML estimates of the basic parameter
difficulties ηj. This comparison can be made
graphically by plotting the estimates δi against
δi*b; on a co-ordinate system.
Alternatively, the comparison can be made more formally by
computing the correlation between δi and
δi*. A further even more formal
comparison can be made using a likelihood-ratio test.
The LLTM can readily be applied to the current experimental
problem because specifying the number of times that each of the
four coherence operations are used to construct the 'ideal' network
effectively is the hypothesis of the 'psychological structure' of
the reading task. As defined by Spada (1977: 228), the
psychological structures of a task are 'the type and number of
cognitive operations ... which enable persons of a certain
population . . . to solve the task.' With regard to Kintsch's
coherence mechanism, these cognitive operations are the coherence
operations carried out by a given type of reader when processing
the text base of a particular passage. The construction of the
'ideal' network is reflected, then, by the correctness of answers
to questions about the text.
The use of the LLTM should provide a powerful test of the
cognitive operations in the reading of a text as proposed by
Kintsch. The empirical study in which such a test was conducted is
outlined next.
THE STUDY
Subjects
The subjects are two hundred naval trainees (all males) with an
average age of 16 years, 6 months.
The sample of readers was divided at the median into two groups,
a 'better readers' group and a 'poorer readers' group. This
division was made on the basis of scores on the reading
comprehension component of the Co-operative Reading Comprehension
Test, Form L (ACER, 1973). The mean raw score for the group of
poorer readers was 22.16, and this corresponded to the 25th centile
in the norming sample of 16-year-old South Australians. The mean
raw score for the group of better readers was 36.81, and this
corresponded to the 85th centile rank in the same norming
sample.
On the basis of the values of 's' and 'n' considered by Kintsch
(Kintsch and van Dijk, 1978; Kintsch and Vipond, 1979), the
following assumptions were made about the working memory
characteristics of each reader type. The poorer readers were seen
to extract no more than ten propositions in each cycle; if a
sentence contained more than ten propositions, the input set
stopped at the nearest phrase boundary. When the sentence boundary
was encountered before n was exceeded, the extraction finished
there. But if the sentence contained less than four propositions,
these readers continued to extract propositions expressed in the
next sentence as part of the same input set. It was expected that
the poorer readers' STM set was limited to three propositions which
they selected according to the 'leading-edge' rule. In contrast,
the better readers were assumed to process no more than fifteen
propositions in each input chunk. Again, if the sentence contained
more propositions, extraction ended at the next phrase boundary,
whereas if it contained less, the input set ended at the boundary.
Processing was assumed to continue across the sentence boundary
only if less than nine propositions had already been extracted.
Again using the 'leading-edge' rule, the better readers should have
selected seven propositions for the buffer.
Materials
The experimental materials were based on ten paragraphs selected
from The Conquest by Sea by G. Avril (1960). This book
contains descriptive prose dealing with the various events and
technological developments in maritime history. Accordingly, it was
expected to be of interest to a group of naval recruits. Further,
the vocabulary, word, sentence and paragraph length, and
grammatical complexity are such that adolescent readers should
experience no decoding difficulties. It was decided to select all
the materials from the one text so as to facilitate comparability
between the passages in terms of surface features and writing
style.
All of the 100-110-word paragraphs contained in this book of 28
chapters were coded. Ten of these paragraphs were randomly selected
with the restricted condition that only one paragraph be chosen
from a particular chapter. This paragraph length was specified
because, as argued by Kintsch and Vipond (1979: 344), a longer text
involves, in addition to the construction of a propositional text
base, a macrostructure analysis. This study is not concerned with
the latter analysis. Only one paragraph was selected from each
chapter because the topic of a chapter establishes a macrostructure
between the text base of two or more of its paragraphs. Because the
topics of the chapters are diverse, it was considered that such a
problem would not arise between paragraphs from different
chapters.
To test the hypothesis of concern to the original broader study,
two versions of each passage were constructed. This was done by the
author using the text base of the original passage as a guide. One
version required both reader types to carry out a number of cycles,
reinstatements, inferences and reorganizations with the poorer
readers requiring to make many more than the better readers. This
was called the low coherence version. The other version
necessitated few of these operations by either reader type and this
was termed the high coherence version.
To illustrate, the low coherence version of the `English
Buccaneers' passage is the one already presented in Table I. The
propositional text base of this passage, which is also given in
Table I, has been derived according to the procedure described in
Kintsch (1974) and consists of 37 propositions which are numbered
and listed according to the order in which their predicates
appeared in the English text. Note that a proposition embedded as
an argument of another proposition is referred to in that
proposition as a number.
As explained previously, propositions are connected if they
share an argument. For example, propositions two and three are
connected because they both contain the argument RICH and further,
propositions one and nine are connected because the former is
embedded as one of the arguments of the latter. The text base is
seen to be connected and therefore coherent, if there is at least
one path from every proposition to every other one.
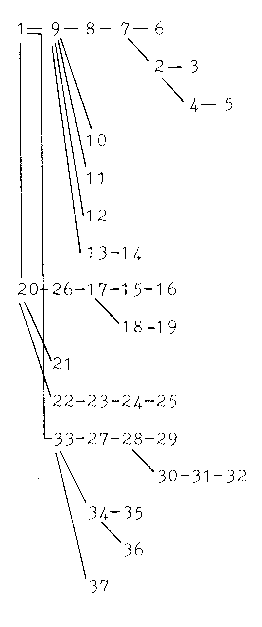
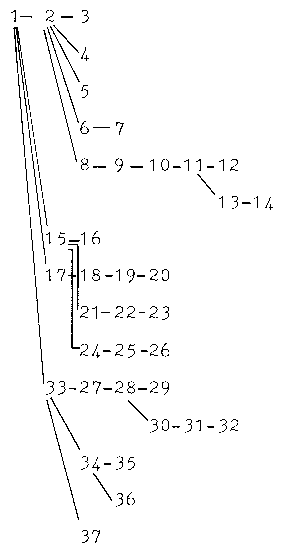
Such connections are seen more clearly in the coherence graph
given in Table I. The network is headed by the proposition
underlying the title of the passage, namely (ENGLISH, BUCCANEERS),
and is called the superordinate proposition. This proposition is
connected, first to proposition nine because it is embedded as an
argument of that proposition, and secondly to proposition 33 as it,
too, contains the argument BUCCANEERS. Third level propositions are
connected to either proposition nine or 33 because they share an
argument with them, but not with the superordinate proposition.
However, proposition 20 leads a separate graph because it does not
share an argument with any of the propositions in the main graph.
Consequently, this text base is not coherent in itself and only
becomes so if the reader makes an inference which connects
propositions one and 20.
TABLE II
THE CONSTRUCTION OF THE TEXT BASE FOR ENGLISH BUCCANEERS PASSAGE -
LOW COHERENCE VERSION*
|
|---|
POORER READERS
n<=10
a=3 |
BETTER READERS
n<=15
a=7 |
|
|
* KEY: ( )-REINSTATEMENT #-INFERENCE
[]REORGANIZATION |
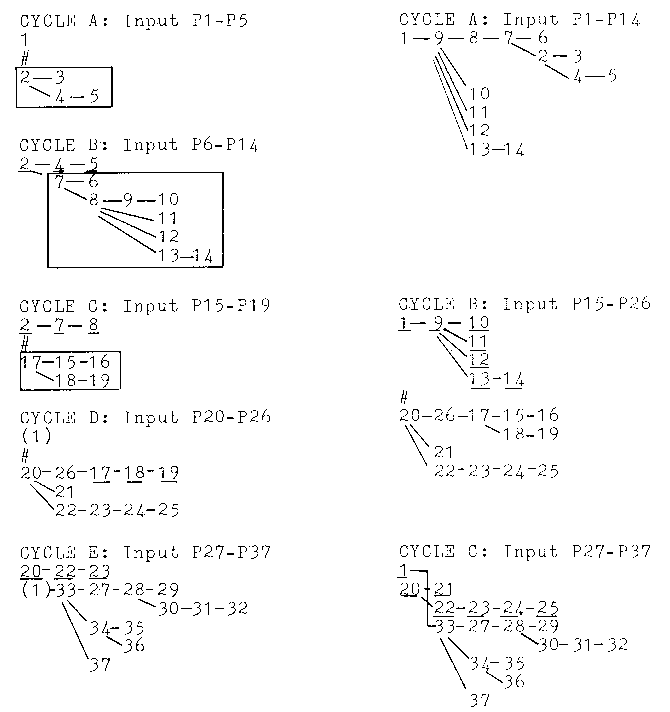
This incoherence places those readers with a more limited
working memory capacity at a distinct disadvantage. This is clearly
indicated in Table II which presents the sequence of cycles by
which each reader type represents the text base in memory as a
coherent network.
To begin, the first sentence plus the title contains five
propositions and so constitutes a processing cycle for the poorer
readers. This is given as CYCLE A. The particular input set does
not contain a proposition to link the title to the first sentence
and an inference is required to establish a connection. As a
result, propositions two to five are assigned to the wrong level in
the hierarchy, as indicated by their enclosure in a box, and a
reorganization will be required during a check of the entire graph.
Carrying over propositions two, four and five (the STM set in each
cycle is underlined), these readers continue to process the nine
propositions contained in the second sentence as CYCLE B. Even
though this input set includes proposition nine, which shares an
argument with the superordinate proposition, the exclusion of the
latter from the STM set allows annexation via the connection
between propositions seven and two.
Comparison of this subgraph with the ideal network in Table I
shows that the propositions are incorrectly placed. As a result,
they require a further reorganization. In contrast, the specified
value of `n' for the better readers allows them to process the
first two sentences as one input set. Because nine, the second
level proposition, is processed in the same cycle as the
superordinate, CYCLE A constructs this subgraph as in the `ideal'
network.
The third sentence is processed by the poorer readers in CYCLE
C. Because the buffer carried over into this cycle fails to provide
any connection, this sentence is annexed via an inference. This
works to assign proposition 17 and its subordinates too high in the
hierarchy. The poorer readers continue to process the next sentence
in CYCLE D. This sentence contains proposition 26, a second level
proposition connected through argument overlap to proposition 17.
This latter proposition and its subordinates constitute the buffer
in this cycle and are correctly subordinated to proposition 26 thus
making the required reorganization during the cycle. However, the
subgraph must still be annexed to the main graph. Therefore,
because no link exists an LTM search is conducted which leads to
the inference that `men' refers to the `English Buccaneers'. Such
an inference requires first that the superordinate is reinstated in
STM.
The better readers process the propositions expressed in the
third and fourth sentences as shown in CYCLE B. These readers do
not stop extraction at the end of the third sentence. This is
because the sentence contains only five propositions and therefore
they continue to process the seven propositions expressed in the
next sentence. The subgraph formed is dominated by proposition 20
and is structured in accordance with the ideal network. Again, the
subgraph is annexed by an inference, but because of the larger STM
capacity of these readers, the subordinate proposition is still in
the buffer. Accordingly they avoid the reinstatement made by the
poorer group of readers.
The last eleven propositions are processed in one cycle by both
the poorer and better readers. This is because `n' is only just
exceeded for the former, while the greater chunking size for the
latter can easily accommodate a sentence of this length. However,
the poorer readers' smaller STM capacity limits the buffer to
propositions 20, 22 and 23, excluding the superordinate proposition
which is connected in the ideal network to 33, the leading
proposition in this subgraph. Annexation, therefore, requires
reinstatement of proposition one, contrasting the better readers
who retain the superordinate in the buffer and so easily connect
this input set to the main graph.
In summary, this text is incoherent and as such might be judged
as difficult to read, especially for the readers characterized by
values of small `s' and 'n'. That is, the poorer readers are
required to perform five cycles, two reinstatements, three
inferences and three reorganizations. The greater working memory
capacity of the better readers largely overcomes this incoherent
structure in that they carry out only three cycles and one
inference in order to construct the `ideal' network.
As shown in Table III, the high coherence version of the
`English Buccaneers' passage differs significantly from the low
coherence version in that the superordinate proposition (ENGLISH,
BUCCANEERS) is connected through argument overlap to all the major
subgraphs constructed from the text base. Consequently, assuming no
processing limitations, the `ideal' network could be constructed
without making any inferences. Because of this coherence and the
particular order by which the propositions are expressed in the
surface structure, this text places few demands on either reader
type.
TABLE III
ENGLISH BUCCANEERS PASSAGE - HIGH COHERENCE VERSION TEXT
ENGLISH BUCCANEERS |
|---|
|
English buccaneers made a number of remarkable voyages round the
world at the beginning of the eighteenth century. These voyages by
the buccaneers were one of the reasons why the eighteenth century
was very rich in voyages of exploration. These men adventured into
the Pacific, which most of them reached by sailing round Cape Horn,
in search of Spanish ships to capture and Spanish towns to hold up
to ransom. After spending a year or eighteen months on the west
coast of South America they returned to England across the Pacific
and Indian Oceans and round the Cape of Good Hope. |
| TEXT BASE |
COHERENCE GRAPH |
1
2
3
4
5
6
7
8
9
10
11
12
13
14
15
16
17
18
19
20
21
22
23
24
25
26
27
28
29
30
31
32
33
34
35
36
37 |
(ENGLISH, BUCCANEERS)
(MADE, 1, VOYAGES)
(NUMBER, VOYAGES)
(REMARKABLE, VOYAGES)
(LOC: ROUND, VOYAGES, WORLD)
(TIME: AT, VOYAGES, 18TH CENTURY)
(BEGINNING, 18TH CENTURY)
(WERE, 2, 9)
(ONE OF, REASONS)
(WHY, REASONS, 11)
(WAS, 18TH CENTURY, RICH)
(VERY, RICH)
(IN, RICH, VOYAGES)
(OF, VOYAGES, EXPLORATION)
(ADVENTURED, 1)
(LOC: INTO, 15, PACIFIC)
(MOST, 1)
(REACHED, 17, PACIFIC)
(BY, 18, 20)
(ROUND, SAILING, CAPE HORN)
(IN SEARCH, 15, SHIPS)
(SPANISH, SHIPS)
(TO CAPTURE, SHIPS)
(IN SEARCH, 15, TOWNS)
(SPANISH, TOWNS)
(HOLD UP, TOWNS, RANSOM)
(TIME: AFTER, 33, 28)
(SPEND, 1,29)
(OR, YEAR, EIGHTEEN MONTHS)
(LOC: ON, 28, COAST)
(WEST, COAST)
(OR, COAST, SOUTH AMERICA)
(RETURNED, 1, ENGLAND)
(ACROSS, 33, OCEANS)
(PACIFIC, OCEAN)
(INDIAN,OCEAN)
(ROUND, 33, CAPE OF GOOD HOPE |
|
TABLE II
THE CONSTRUCTION OF THE TEXT BASE FOR ENGLISH BUCCANEERS PASSAGE -
HIGH COHERENCE VERSION*
|
|---|
POORER READERS
n<=10
a=3 |
BETTER READERS
n<=15
a= 7 |
|
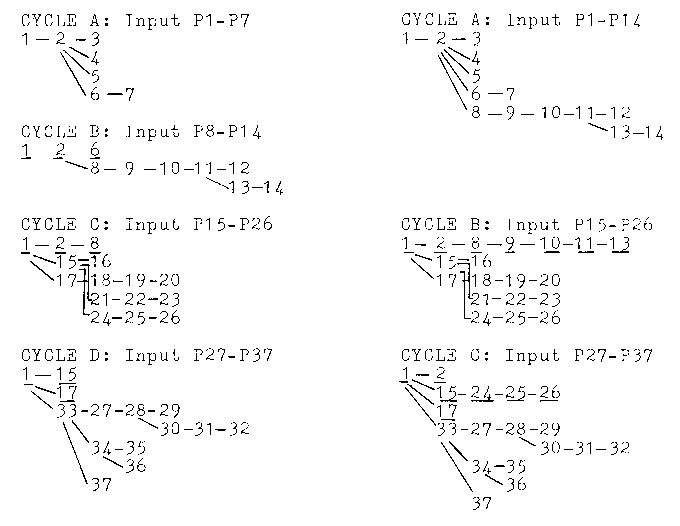
This is made explicit in Table IV which shows the text base
construction carried out by the better and poorer readers. The
first cycle by the poorer readers contains seven propositions which
ends extraction at the sentence boundary and forms an `ideal'
subgraph. CYCLE B processes the second sentence, which is expressed
by nine propositions and so is more compatible with the poorer
readers' input size. Because the buffer contains the superordinate
proposition and its subordinate, this subgraph is easily annexed to
the graph constructed so far, with all propositions being assigned
their proper status.
Processing the first two sentences is even less demanding for
the better readers who process all 14 propositions in one cycle.
The next twelve propositions are processed by the poorer readers in
CYCLE C which the readers were able to extract in one chunk. This
was possible because the phrase boundary following the tenth
proposition coincided with the end of the sentence. The better
readers process this sentence in an identical fashion. The last
sentence contains eleven propositions and is processed in one cycle
by both reader types, thus completing the construction of the ideal
graph. This high coherence version might therefore be described as
an easy text because it requires no reinstatements, inferences or
reorganizations; the only difference between the reader types is
that the poorer readers must make one more cycle.
TABLE V
ENGLISH BUCCANEERS PASSAGE - ORIGINAL VERSION TEXT |
|---|
|
One of the reasons why the eighteenth century was so rich in
voyages of exploration was because at the beginning of the century
there were a number of remarkable voyages round the world made by
the English buccaneers. These men adventured into the Pacific in
search of Spanish ships to capture and Spanish towns to hold up to
ransom. Most of them reached the Pacific by sailing round Cape Horn
and, after spending a year or eighteen months on the west coast of
South America, returned to England across the Pacific and Indian
Oceans and round the Cape of Good Hope.
|
| TEXT BASE |
COHERENCE GRAPH |
1
2
3
4
5
6
7
8
9
10
11
12
13
14
15
16
17
18
19
20
21
22
23
24
25
26
27
28
29
30
31
32
33
34
35
36
37 |
(ONE OF, 2)
(REASONS, 3)
(WAS, 18TH CENTURY, RICH)
(SO, RICH)
(IN, RICH, VOYAGES)
(OF, VOYAGES, EXPLORATION)
(BECAUSE, 2, 11)
(TIME AT, 11, 18TH CENTURY)
(BEGINNING, 18TH CENTURY)
(NUMBER, 11)
(REMARKABLE, VOYAGES)
(LOC: ROUND, 11, WORLD)
(BY, 11, BUCCANEERS)
(ENGLISH, BUCCANEERS)
(ADVENTURED, 14)
(LOC: INTO, 15, PACIFIC)
(IN SEARCH, 15, SHIPS)
(SPANISH, SHIPS)
(TO CAPTURE, SHIPS)
(IN SEARCH, 15, TOWNS)
(SPANISH, TOWNS)
(HOLD UP, TOWNS, RANSOM)
(MOST, 14)
(REACHED, 23, PACIFIC)
(BY, 24, 26)
(ROUND, SAILING, CAPE HORN)
(TIME: AFTER, 33, 28)
(SPEND, 23, 29)
(OR, YEAR, EIGHTEEN MONTHS)
(LOC: ON, 28, COAST)
(WEST, COAST)
(OF, COAST, SOUTH AMERICA)
(RETURNED, 23, ENGLAND)
(ACROSS, 33, OCEANS)
(PACIFIC, OCEAN)
(INDIAN, OCEAN)
(ROUND, 33, CAPE OF GOOD HOPE) |
|
As a point of interest, the original 'English Buccaneers'
passage is presented in Table V along with the text base and
coherence graph. Although this text is coherent in that all the
major subgraphs are connected to the superordinate proposition, the
lengths of the sentences contained in this passage are
inappropriate to the chunking capacity of both reader types and
further, the writer failed to express the important ideas at the
beginning of the sentences. Presentation of the text base
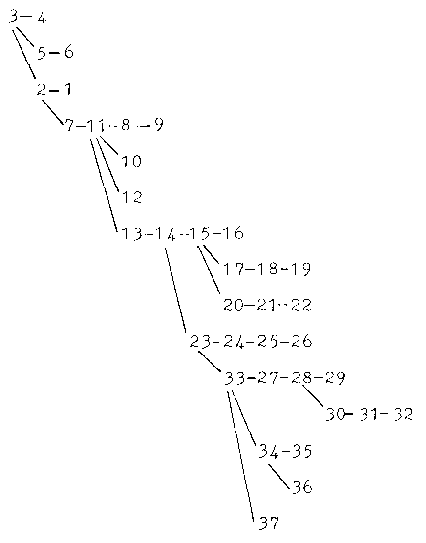
construction would show that this text is processed by the less
able readers in four cycles, three of which involve reinstatements,
and further, necessitates a reorganization during a check of the
entire graph. The better readers avoid any reinstatements during
the three cycles they perform. However, they are still required to
carry out a reorganization. In terms of comprehensibility, then,
this original passage is located somewhere between the low and high
coherence versions constructed for the study.
It is important to comment briefly on the comparability of the
high and low coherence versions of each passage in terms of both
surface and microstructure variables. First, the passages ranged in
length from 100 to 110 words across both versions and, more
importantly, the largest difference between any two versions was
only four words. Less uniform were the number of sentences. Some of
the low coherence versions of a passage contain up to three more
sentences than the high coherence counterpart. The number of
propositions expressed in these texts ranged from 37 to 46,
although the difference between the low and high coherence versions
for each passage was no more than one. Finally, the computed Flesch
(1948) reading ease (RE) scores for these passages varied between
74 and 97 suggesting that these texts should be easy to read. The
RE difference between the low and high coherence versions ranged
widely across the passages from one to eleven points on the
readability scale. Generally, the low coherence versions had a
higher Flesch score than the high coherence versions.
The Dependent Variable
According to the model under investigation, if the operations
required to process the text base are not carried out, then the
memorial representation is incomplete, disconnected and
disorganized. Therefore, a task which attempted to disclose the
failure by the readers to construct the 'ideal' network was
devised.
This task required the subjects to identify a single sentence
summary of each passage by distinguishing it from three
alternatives which were increasingly less like the meanings
conveyed by the text base. The summary and its alternatives
consisted of statements representing the superordinate propositions
leading the major subgraphs in the text base of the original
passage. In the correct summary, these statements were related as
in the ideal network by explicit connectives, even though some were
only implied in the text base of the original passage. The
alternatives did likewise, except that they progressively distorted
these links.
The rationale behind these questions is that the correct
summaries are equivalent in meaning to the passages and contain the
same substantive words. Therefore, even though it contains fewer
propositions, each can be processed into a representation which
mirrors the structure of the 'ideal' network. When asked to choose
the summary closest in meaning to the passage, readers who have
carried out the required cycles, reinstatements, inferences and
reorganizations will match their representation with the structure
of the correct summary. Those subjects who fail to construct the
'ideal' network will, amongst other things, not form the correct
links between the major subgraphs and will therefore be more likely
to select one of the alternative summaries. The more disconnected
the representation, the greater the chance that the reader will
choose an alternative which violates most or all of the
relationships within the original text base. This argument assumes
that the summaries are themselves easily processed by both reader
types.
To illustrate, consider the `English Buccaneers' passage given
earlier. The correct summary, as presented in Table VI is
constructed from the leading propositions in the text base of this
passage with one or two propositions from each of the major
subgraphs being included. The incorrect summaries are also shown in
Table VI and while expressing the same leading proposition and
their subordinates, they contain different connective propositions.
Clearly, these manipulations distort the relationships within the
original text base and so the meanings of these summaries deviate
increasingly from that of the original passage.
These summary questions can be considered as tests of
comprehension because readers cannot answer them correctly unless
they have semantically encoded the passage. Objection to this might
be raised in that the summaries share substantive words with the
passage and so the correct summary might be identified as such by
matching orthography or phonology. However, these words are common
to all four alternatives which differ only in the connectives used
and these were rarely taken directly from the passages; indeed on
most occasions they were not even explicit in the text. Therefore,
the correct summary is related by meaning and not surface feature
and so must be comprehended in order to be matched with the
passage.
TABLE VI
SUMMARIES OF THE ENGLISH BUCCANEERS PASSAGE* |
|---|
Correct Summary
The eighteenth century was rich in voyages of exploration
because of the number of remarkable voyages by the
English buccaneers adventuring into the Pacific, most of whom
returned to England round the Cape of Good Hope.
Incorrect Summaries
The eighteenth century was rich in voyages of exploration
after a number of remarkable voyages by the English
buccaneers adventuring into the Pacific, most of whom
returned to England round the Cape of Good Hope.
The eighteenth century was rich in voyages of exploration
after a number of remarkable voyages but the English
buccaneers adventured in to the Pacific, most of whom
returned to England round the Cape of Good Hope.
The eighteenth century was rich in voyages of exploration
after a number of remarkable voyages but the English
buccaneers adventured into the Pacific, while others
returned to England round the Cape of Good
Hope. |
| * Alternatives listed in
order of increasing distortion with connectives
underlined. |
Design
A consequence of the design for the wider study was that the
data analyzed by the LLTM were collected from four populations. One
data set was provided by the better readers who were administered
the high coherence versions of the first five passages (SET A) and
the low coherence versions of the remaining five passages (SET B).
Another data set was obtained from the poorer readers allocated
this same combination of the SET A and SET B passages. The other
two data sets were those for the better and poorer readers given
the low coherence versions of the SET A passages and the high
coherence versions of the SET B passages. Allocation of the reader
types to these set combinations was random.
Procedure
The experimental passages and the summary questions were
presented in a test booklet, with separate forms being constructed
for the high and low coherence versions of each set. Testing took
place in the regular class groupings which ranged in size from 20
to 30 students. The subjects were instructed to read each passage
as quickly as possible and following the completion of another task
which is not of importance here, were required to choose the
summary which was closest in meaning to the passage they had just
read. For the LLTM analysis, the selection of the correct summary
was scored 1 while the choice of an incorrect alternative was
scored 0.
Task Structure Hypotheses
The estimated difficulties of the summary questions can be
decomposed into the basic parameters attached to cycles
(*eta;1), reinstatements (η2), inferences
(η3) and reorganizations (η4). The
weight given to these operations in the summary items is the
frequency by which they are carried out in order to construct the
ideal network. These operation frequencies can be summarized into
the task structure matrix Qkxm, where k is the number of
items and m is the number of basic operations. A different matrix
is required for each of the four data sets as the number of
operations varies according to the type of reader and version of
the passage. These frequency matrices are presented in Table
VII.
RESULTS
Analysis of the responses on the summary questions according to
the LLTM was carried out using the LLTM2 program. (LLTM2, Linear
Logistic Test Model, Version 2. The University of Western
Australia, 1980.) This routinely estimates the basic parameters
ηj and their standard errors and provides the item
difficulties recovered from ηj and the Q matrix.
Further, the program re-runs the data to estimate the item
difficulties and their standard errors according to the SLM.
Lastly, a likelihood-ratio test is carried out. This test is given
by (5) below:
|
χ2 = -2 [L - L(0)] on K-1-M degrees of
freedom,
| (5) |
where L is the log-likelihood which corresponds to
δi*, and and L(0) is the
loglikelihood formed from δi.
TABLE VII
TASK STRUCTURE MATRICES |
|---|
|
PASSAGE
|
ITEM
|
POORER READERS
Set A-Low Coh.
Set B-High Coh.
|
POORER READERS
Set A-High Coh.
Set B-Low Coh.
|
BETTER READERS
Set A-Low Coh.
Set B-High Coh.
|
BETTER READERS
Set A-High Coh.
Set B-Low Coh.
|
| |
OPERATIONS * |
|
V1 |
V2 |
V3 |
V4 |
V1 |
V2 |
V3 |
V4 |
V1 |
V2 |
V3 |
V4 |
V1 |
V2 |
V3 |
V4 |
1
2
3
4
5
6
7
8
9
10 |
SQ01
SQ02
SQ03
SQ04
SQ05
SQ06
SQ07
SQ08
SQ09
SQ10
|
7
7
8
5
5
6
5
5
5
5 |
2
3
2
2
2
3
3
2
2
2
|
4
2
4
3
2
0
0
0
0
0
|
2
3
3
3
4
0
0
0
0
0
|
5
6
5
4
4
6
7
5
7
6
|
0
2
2
0
0
2
3
3
3
3
|
1
0
1
0
1
1
2
1
2
3
|
0
0
0
0
0
3
3
2
3
3
|
4
4
4
3
3
4
4
3
4
4
|
0
1
0
0
2
1
1
1
1
O
|
3
2
3
1
1
0
0
0
0
0
|
1
2
0
0
1
0
0
0
0
0
|
4
3
4
3
3
4
4
3
4
3
|
0
0
0
0
0
1
0
1
0
2
|
1
0
1
0
1
1
1
0
0
1
|
0
0
0
0
0
2
1
1
0
1
|
|
* KEY: Vl = cycles, V2 = reinstatements, V3 = inferences, V4 =
reorganizations |
TABLE VIII
CHI-SQUARE GOODNESS-OF-FIT VALUES
OBTAINED FOR SUMMARY QUESTION DATA SETS
|
|---|
|
Data Set
|
χ2(5) |
Poorer Readers
Set A - Low Coherence
Set B - High Coherence
| 55.94* |
Poorer Readers
Set A - High Coherence
Set B - Low Coherence
| 74.57* |
Better Readers
Set A - Low Coherence
Set B - High Coherence
| 38.10* |
Better Readers
Set A - High Coherence
Set B - Low Coherence
| 78.11* |
|
* p < .05 |
As shown in Table VIII, the likelihood-ratio tests carried out
during the LLTM analyses of the data obtained from the
administration of the summary questions to the four groups yielded
chi-squares all of which exceeded the critical value of
χ2 = 11.07 at the 5 per cent level of confidence.
Thus, the recovered item difficulties did not correspond perfectly
to those estimated by the SLM.
The correlations between the recovered difficulties of the
summary questions and the estimates according to the SLM within
each data set are given in Table IX. Except for the correlations
computed for the poorer readers who were given the SET A high
coherence versions and the SET B low coherence versions, all are
significantly different from zero, p < .05. That is, the t
statistic computed from these coefficients exceeds the critical
value of t = 1.86 on 8 degrees of freedom at the 5 per cent level
of confidence.
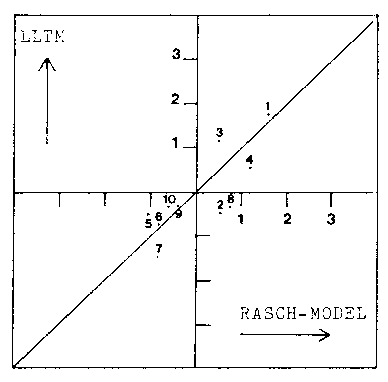
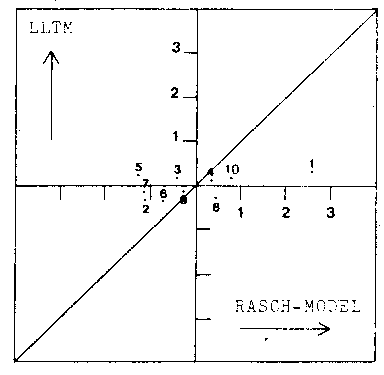
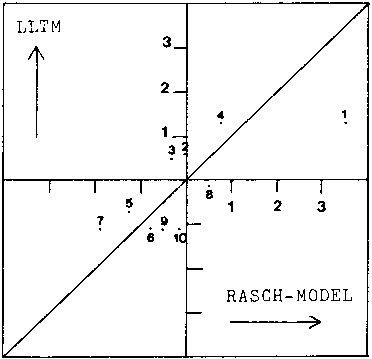
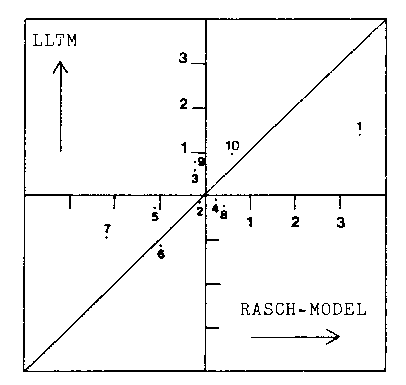
The graphical comparison of the recovered difficulties of the
summary questions with those provided by the SLM are presented in
Figure 1. The most significant deviations from the null hypothesis
line of a perfect correlation between these estimates will be
highlighted in the discussion.
TABLE IX
CORRELATION BETWEEN
LLTM AND BASIC RASCH-MODEL DIFFICULTY ESTIMATES
OF SUMMARY QUESTIONS
|
|---|
|
Data Set
|
Correlation
Coefficient
|
ta |
Poorer Readers
Set A - Low Coherence
Set B - High Coherence
| .79 | 3.69* |
Poorer Readers
Set A - High Coherence
Set B - Low Coherence
| .37 | 1.11 |
Better Readers
Set A - Low Coherence
Set B - High Coherence
| .76 | 3.33* |
Better Readers
Set A - High Coherence
Set B - Low Coherence
| .62 | 2.25*
|
a The ratio is distributed as t with n-2 degrees of freedom,
thus 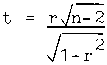
|
|
* p < .05 |
DISCUSSION
The likelihood-ratio tests provided by the LLTM and subsequent
correlational analysis of the recovered difficulties of the summary
questions and those provided by the SLM revealed that although the
relationship between these parameter values was less than perfect,
it was far from being zero in the majority of the data sets. That
is, the hypothesized task structure matrices specified for the
better and poorer readers on the SET A low coherence versions and
the SET B high coherence versions, and for the better readers on
the other combination of the passage versions, accounted for
between 38 per cent and 62 per cent of the variance in the item
difficulties. This means that these task structure hypotheses were
generally valid and further that the formalization of these
hypotheses in terms of the LLTM was reasonably correct. Thus, one
summary question was more difficult than another if the passage to
which it related required more cycles, reinstatements, inferences
and reorganizations in order to be represented as in the `ideal'
network. Further, the microprocessors seem to have encompassed a
significant part of the difficulty associated with each of the
summary questions.
FIGURE 1
GRAPHICAL COMPARISON OF LLTM AND BASIC RASCH-MODEL ESTIMATES
|
|---|
a. Poorer Readers
Set A Low Coherence Versions
Set B High Coherence Versions
|
b. Poorer Readers
Set A High Coherence Versions
Set B Low Coherence Versions
|
c. Better Readers
Set A Low Coherence Versions
Set B High Coherence Versions
|
d. Better Readers
Set A High Coherence Versions
Set B Low Coherence Versions
|
Some of the task structures for these data sets, however, were
not valid since the relationships between the difficulty estimates
recovered from the LLTM and obtained from the SLM were
significantly different from unity or perfection. The graphical
comparison of these estimates indicated that the most deviant task
structures were those of the summary questions about passages ONE
and SEVEN. The former item difficulty was most often harder than
expected from the hypothesized task structure. This may have arisen
from the position of the passage in the test booklets. Because the
summary questions were a novel reading comprehension task and even
though a warm-up passage was included, the subjects may still have
been unsure about what was required at this early stage of the
test. In contrast, the summary question about passage SEVEN was
nearly always easier than expected from its hypothesized task
structure. Because this trend was most pronounced in the data sets
involving the low coherence version of passage SEVEN, it appears
that the passage manipulations were particularly ineffective for
this text.
The correlations between the LLTM and SLM difficulties in the
remaining data set, namely the administration of the SET A high
coherence versions and the SET B low coherence versions to the
poorer readers, did not differ significantly from zero. This
indicates that many of the task structures specified for this group
were invalid. Examination of the direction of the deviations
between the two estimates of the item difficulties failed to
suggest any reason why this might be so.
Generally, however, these results can be taken to provide
support for the assumption that the coherence operations contribute
to the difficulty by which microstructure is processed. Further,
the amount of variation in the difficulty of the experimental
passages explained by these four operations is particularly
significant when one considers the many encoding variables involved
in reading comprehension which are ignored by the model of
coherence.
As in the studies by Kintsch and van Dijk (1978); Kintsch and
Vipond (1979), the size of the buffer and input chunks were
specified only for two classes of readers, the better and poorer
readers in the particular group. Had different values been chosen
for a more precise grouping of reader types, the task structures
hypothesized might have been shown to be more valid. It was a
weakness of the design that more data was not available to permit
this more precise specification of the task structure matrices.
It is necessary, therefore, to collect a more extensive set of
data so that the working memory characteristics of different types
of readers can be determined more precisely. The use of different
strategies by which propositions are selected for the STM set must
also be examined as should also the relationship between the
syntactic boundaries and the processing limitations of the reader.
With the added constraints provided by such investigations,
Kintsch's coherence mechanism may provide a powerful simulation
model for the cognitive operations by which the reader abstracts
meaning from written discourse.
An important methodological implication of this study is the
value of the LLTM as an investigative tool. The alternative
procedure would have been to use multiple regression. There are,
however, many analytic and interpretative problems associated with
this technique. Particularly relevant to this study are the
pitfalls of collinearity and suppression between some of the
predictor variables. There is also the problem of the order by
which the variables would be entered into the regression equations
and, further, the resulting regression weights can change from
sample to sample. Lastly, regression analysis here would involve
mean performances on the dependent variables which only considers
variance at the group level. The LLTM avoids all of these
problems.
Of further interest is the fact that the number of coherence
operations was found to be a more accurate predictor of the
difficulty of the experimental passages than the computed Flesch
(1948) reading ease scores. This highlights the inadequacy of this
index and others like it. It would seem that readability formulae
must go beyond the surface features of text and, more importantly,
readability should be considered as a text-reader interaction
rather than a property of the text alone.
A final implication of this study is in the process of writing,
particularly in the area of instructional text. That is, if skilled
and less skilled readers do process text in qualitatively different
ways, it would appear that different writing styles need to be
adopted for different types of readers. In fact, this investigation
suggests a number of writing rules which should make the
comprehension process easier, particularly for the less able
readers. First, all the important information should be stated
explicitly in the text. Secondly, a common element should relate
the beginning of each sentence to the preceding information:
Thirdly, ideas about the same concept should not be separated in
the text. Finally, sentence length should not be too long nor too
short.
REFERENCES
Australian Council for Educational Research, Manual for
Cooperative Reading Comprehension Test (Forms L and M),
Hawthorn, Victoria: 1973.
Avril, G., The Conquest of Sea, London: Burke,
1960.
Bobrow, D. G. & A. Collins (eds), Representation and
Understanding: Studies in. Cognitive Science, New York:
Academic Press, 1975.
Caroll, J. B. & R. O. Freedle (eds), Language Comprehension
and the Acquisition of Knowledge, Washington, D.C.: Winston &
Sons, 1972.
Crothers, E. J., 'Memory Structure and the Recall of Discourse',
in Language Comprehension and the Acquisition of Knowledge,
J. B. Caroll & R. O. Freedle (eds), Washington, D.C.: Winston
& Sons, 1972, 247-83.
De Gruijter, D. & L. van der Kamp (eds), Advances in
Psychological and Educational Measurement, Bern: Huber,
1976.
Dressler, W. U. (ed.), Current Trends in Textlinguistics,
Berlin, New York: de Gruyter, 1977.
Estes, W. K., Handbook of Learning and Cognitive Processes
6, Hillsdale, New Jersey: Lawrence Erlbaum Associates,
1978.
Fischer, G. H., 'The linear logistic test model as an instrument
in educational research', Acta Psychologica 37 (1973),
359-74.
Fischer, G. H., 'Some probabilistic models for measuring
change', in Advances in Psychological and Educational
Measurement, D. De Gruijter & L. van der Kamp (eds), Bern:
Huber, 1976, 107-12.
Fischer, G. H., 'Linear logistic test models: Theory and
application', in Structural Models of Thinking and Learning,
H. Spada & W. F. Kempf (eds), Bern: Huber, 1977,203-25.
Flesch, R., 'A New Readability Yardstick', Journal of
Applied Psychology 32 (1948), 221-33.
Frederiksen, C. H., 'Effects of Task-Induced Cognitive
Operations on Comprehension and Memory Processes', in Language
Comprehension and the Acquisition of Knowledge, J. B. Caroll
& R. O. Freedle (eds), Washington, D.C.: Winston & Sons,
1972,211-45.
Frederiksen, C. H., 'Acquisition of Semantic Information from
Discourse: Effects of Repeated Exposures', Journal of Verbal
Learning and Verbal Behavior 14 (1975a), 158-69.
Frederiksen, C. H., 'Effects of Context--Induced Processing
Operations on Semantic Information Acquired from Discourse',
Cognitive Psychology 7 (1975b), 139-66.
Frederiksen, C. H., 'Representing Logical and Semantic Structure
of Knowledge Acquired from Discourse', Cognitive Psychology
7 (1975), 371-458. (c)
Just, M. A. & P. A. Carpenter (eds), Cognitive Processes in
Comprehension, Hillsdale, New Jersey: Lawrence Erlbaum
Associates, 1977.
Kintsch, W., The Representation of Meaning in Memory.
Hillsdale, New Jersey: Lawrence Erlbaum Associates, 1974.
Kintsch, W., 'Comprehension and Memory of Text', in Handbook
of Learning and Cognitive Processes, Vol. 6, W. K. Estes
(ed.), Hillsdale, New Jersey: Lawrence Erlbaum Associates, 1978,
57-86.
Kintsch, W. & T. A. van Dijk, 'Toward a model of text
comprehension and production', Psychological Review 8
(1978), 363-94.
Kintsch, W. & D. Vipond, 'Reading comprehension and readability
in educational practice and psychological theory', in
Perspectives on Memory Research, L. G. Nilsson (ed.),
Hillsdale, N.J.: Erlbaum, 1979, 329-66.
Meyer, B. J. F., The Organization of Prose and its Effects
on Memory. Amsterdam: North-Holland Publishing Co., 1975.
Nilsson, L. G. (ed.), Perspectives on Memory Research.
Hillsdale, NJ.: Erlbaum, 1979.
Rasch, G., Probabilistic Models for Some Intelligence and
Attainment Tests, Chicago: University of Chicago Press,
1980.
Rumelhart, D. E., 'Notes on a Schema for Stories', in
Representation and Understanding. Studies in Cognitive Science,
D. G. Bobrow & A. Collins (eds), New York: Academic Press,
1975, 211-36.
Spada, H., 'Logistic models of learning and thought', in
Structural Models of Thinking and Learning, H. Spada & W.
F. Kempf (eds), Vienna: Huber, 1977, 227-62.
Spada, H. & W. F. Kempf (eds), Structural Models of Thinking
and Learning, Vienna, Hans Huber Publishers, 1977.
Thorndyke, P. W., 'Cognitive structures in Comprehension and
Memory of Narrative Discourse', Cognitive Psychology 9
(1977), 77-110.
Turner, A. & E. Greene, The Construction of a Propositional
Text Base. Technical Report, University of Colorado, 1977.
van Dijk, T., 'Macro-structures and Cognition', in Cognitive
Processes in Comprehension, M. Just & P. Carpenter (eds),
Hillsdale, New Jersey: Lawrence Erlbaum Associates, 1977, 3-32.
van Dijk, T. & W. Kintsch, 'Cognitive Psychology and Discourse:
Recalling and Summarizing Stories', in Current Trends in
Textlinguistics, W. U. Dressier (ed.), Berlin, New York: de
Gruyter, 1977, 61-80.
Using the Linear Logistic Test Model to Investigate a Discourse-based Model of Reading Comprehension, S. L. Latimer
Education Research and Perspectives, 9:1, 1982, 73-94.
Reproduced with permission of The Editors, The Graduate School of Education,
The University of Western Australia. (Clive Whitehead, Oct. 29, 2002)
Rasch Models for Measurement in Educational and
Psychological Research
Education Research and Perspectives. Vol. 9, No. 1 June 1982 |
|---|
- Editorial, David Andrich and Graham Douglas, Guest Editors
- An Unconditional Likelihood Ratio for Testing Item Homogeneity in the Rasch Model, Dr. Jürgen Rost
- Defining a 'Fear-of-Crime' Variable: A Comparison of Two Rasch
Models, Geofferey N. Masters and Benjamin D. Wright. [This is Chapter 7 in "Rating Scale Analysis".]
- Issues in the Fit of Data to Psychometric Models, Graham Douglas
- Comparison of Likelihood Ratio χ2 and Pearsonian χ2 Tests of Fit in the Rasch Model, Richard M. Smith and Larry V. Hedges
- The Measurement of Change as the Study of the Rate of Change, Barry V. Kissane
- Using the Linear Logistic Test Model to Investigate a Discourse-based Model of Reading Comprehension, S. L. Latimer
- An Index of Person Separation in Latent Trait Theory, the Traditional KR-20 Index, and the Guttman Scale Response Pattern, David Andrich
- Person Fit and Person Reliability, Richard C. Bell
- Research Note: Detecting a Response Set to Likert-style Attitude Items with the Rating Model, Leonie J. Rennie
|
Go to Top of Page
Go to Institute for Objective Measurement Page