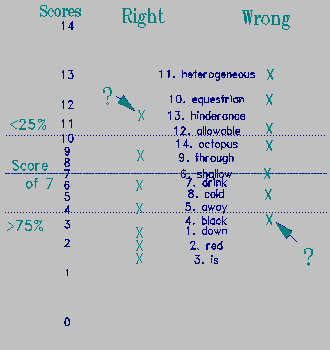
KIDMAPs are graphical presentations of valuable information on the strengths and weaknesses of students' performances. The y-axis locates each item by difficulty. The x-axis stratifies items by student success or failure (RMT 4:1, p. 97, RMT 8:1 p. 345, RMT 8:2 p. 366). As early as 1994, more than 1 million computer-drawn KIDMAPs had been produced. Though not as precise as computer-drawn KIDMAPs, those drawn by hand are instructive for teachers and motivational for students:
1. Count how many students took the test, either on this or a previous occasion, N.
2. Count the number of right, R, and wrong, W=N-R, answers to each test item.
3. Item location = loge(W/R) for each item.
4. Plot the items on the y-axis of a graph, half-way across a sheet of paper. Use an easy scaling such as 1 logit = 1 inch. Write the item number and a brief summary of each item at its position.
5. For the L items on the test, mark student raw scores at their y-axis location on the left side of the sheet, e.g, "20" at loge(20/L-20). For a score of 0 use .3, and for L use L-0.3.
6. Cut off the raw scores on the left side of the sheet of paper and then slide them up and down until the middle of the raw scores is aligned with the middle of the items.
6. You now have the basic KIDMAP form. Photocopy as many as you need, probably at least N.
7. Distribute the photocopied blank KIDMAPs to the students, together with their scored (or unscored) answer sheets.
8. For each item, have each student place a check mark to the left of the item on the KIDMAP for correct responses, to the right for incorrect.
9. Have the students add up their raw scores, and draw a line across the sheet from that raw score on the left side.
10. Have the students draw dotted lines one inch above and one inch (one logit) below their raw score lines, these represent 25% and 75% expected success levels.
11. Unexpected successes are above the upper dotted line in the top left quadrant.
12. Unexpected failures are below the lower dotted line in the bottom right quadrant.

In the Figure, a student has a score of 7 on a 14 item reading test. We see that he has an unexpected success on item 7, "hinderance", and an unexpected failure on item 4, "black". Now we know where to congratulate and where to remediate!
The main difference between a hand-drawn and computer-produced KIDMAP is the vertical scaling. Hand scaling ignores the spread of persons in calibrating the items, and items in measuring the persons. Nevertheless, relative positioning is approximately the same.
Lee Yew Jin, Victoria School
Yeoh Oon Chye, National Institute of Education
Singapore
KIDMAP construction by hand.Lee Y.J., Yeoh O. C. … Rasch Measurement Transactions, 1998, 12:2 p. 640.
| Forum | Rasch Measurement Forum to discuss any Rasch-related topic |
Go to Top of Page
Go to index of all Rasch Measurement Transactions
AERA members: Join the Rasch Measurement SIG and receive the printed version of RMT
Some back issues of RMT are available as bound volumes
Subscribe to Journal of Applied Measurement
Go to Institute for Objective Measurement Home Page. The Rasch Measurement SIG (AERA) thanks the Institute for Objective Measurement for inviting the publication of Rasch Measurement Transactions on the Institute's website, www.rasch.org.
| Coming Rasch-related Events | |
|---|---|
| Jan. 16 - Feb. 13, 2025, Fri.-Fri. | On-line workshop: Rasch Measurement - Core Topics (E. Smith, Winsteps), www.statistics.com |
| Apr. 8 - Apr. 11, 2026, Wed.-Sat. | National Council for Measurement in Education - Los Angeles, CA, ncme.org/events/2026-annual-meeting |
| Apr. 8 - Apr. 12, 2026, Wed.-Sun. | American Educational Research Association - Los Angeles, CA, www.aera.net/AERA2026 |
| May. 15 - June 12, 2026, Fri.-Fri. | On-line workshop: Rasch Measurement - Core Topics (E. Smith, Winsteps), www.statistics.com |
| June 19 - July 25, 2026, Fri.-Sat. | On-line workshop: Rasch Measurement - Further Topics (E. Smith, Winsteps), www.statistics.com |
The URL of this page is www.rasch.org/rmt/rmt122t.htm
Website: www.rasch.org/rmt/contents.htm