
 |
 |
 |
 |
 |
 |
"Multidimensional-scaling (MDS) models are based on the idea that a set of ordinal data can be converted into a smaller amount of cardinal information" (Nijkamp & Voogd, 1984, p. 201). Rasch measurement is based on the same idea. But do these methods find the same information?
30 schools districts in the Chicago suburbs have been ranked on their performance on each of 13 state-mandated tests. These data have been analyzed with MDS and also with a principal components analysis (PCA) of Rasch residuals (RRP).
Analysis of "Items"
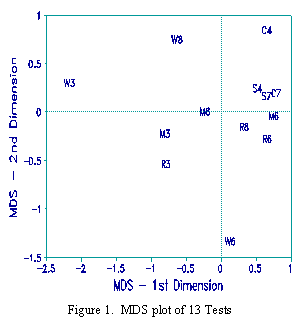
Figure 1 shows an MDS plot, produced using the default options of SYSTAT, with the 13 tests treated as
"variables". W is Writing, R is Reading, M is Math, S is Science, C is Social Studies. The number is the grade
level, e.g., W3 is Writing - 3rd Grade. On the plot, W3, W6 and W8 are all outliers, but in different directions.
There is little natural clustering by either subject area or grade level.
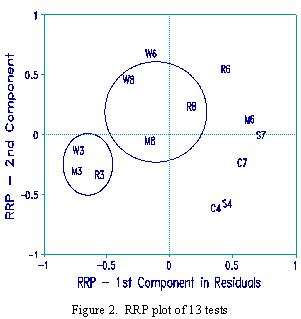
The identical data were subjected to Rasch analysis. Since the schools are rank ordered, all 13 tests (treated as items) have the same raw score and the same measure. The Rasch analysis confirmed the MDS finding that W3, W6 and W8 are the most misfitting tests. Figure 2 plots the first two principal components in the Rasch residuals. Clusters and patterns are now evident both by subject area and grade level. The Rasch Figure is easier to interpret and suggestive. The fact that W3, W6 and W8 form a cluster on this plot suggests that their commonalities are greater than their differences. This example suggests that Rasch analysis is a powerful investigative tool even when measurement construction is not the primary objective.
Analysis of "persons"
The MDS and Rasch analyses were continued focusing on the schools as "cases" or "persons". Figure 3 shows an
MDS plot of the 30 schools, identified by District number. It has the appearance of a ring. This plot suggests that
there are two processes at work, but gives little guidance to what they are.
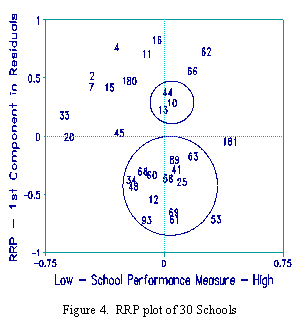
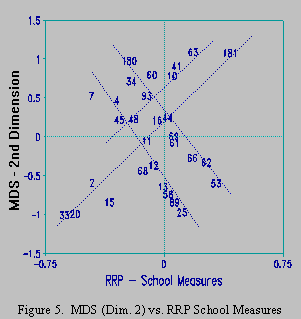
The RRP plot for the schools is Figure 4. Since the schools were rank ordered on the 13 Tests, the schools have different sums of ranks, and so different measures. Since measures are available, they are plotted along the x-axis. School 181 is the highest ranked overall, school 33 the lowest. Now the y-axis in the MDS plot, Figure 3, is seen to be a faint shadow of overall school performance. This is depicted by the main diagonal in Figure 5, but sub-diagonals compound the difficulty of interpreting the first MDS dimension.
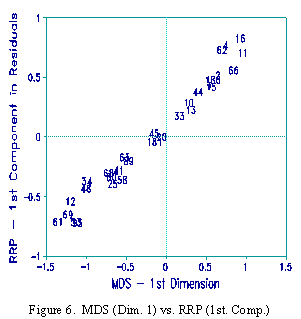
The y-axis in Figure 4, the RRP plot, is the first principal component in the Rasch residuals. By inspection of the raw data, it is seen that the schools at the positive pole of this component are strong in Writing and 3rd Grade performance relative to schools at the negative pole. On this plot, clusters of similarly performing schools are apparent. This axis corresponds to the x-axis in Figure 3, the MDS plot, as shown in Figure 6.
These plots are remarkable. According to Figure 6, the misfit from the Rasch model has been captured by the MDS
analysis. But, according to Figure 5, the level of overall school performance, a typical focus of studies such as this,
has been almost lost in the MDS results. MDS has not been as successful as Rasch in extracting cardinal information
from ordinal data.
John Michael Linacre
Nijkamp P., Voogd H. (1984) Multidimensional and homogenous scaling in spatial analysis. Chapter 12 in Bahrenburg G., Fischer M.M., Nijkamp P. (Eds.) Recent Developments in Spatial Data Analysis: Methodology, Measurement, Models. Brookfield, Vermont: Gower Publishing Co.
Rasch PCA residual analysis Linacre, J.M. Multidimensional scaling vs. … Rasch Measurement Transactions, 1999, 13:1 p. 684
| Forum | Rasch Measurement Forum to discuss any Rasch-related topic |
Go to Top of Page
Go to index of all Rasch Measurement Transactions
AERA members: Join the Rasch Measurement SIG and receive the printed version of RMT
Some back issues of RMT are available as bound volumes
Subscribe to Journal of Applied Measurement
Go to Institute for Objective Measurement Home Page. The Rasch Measurement SIG (AERA) thanks the Institute for Objective Measurement for inviting the publication of Rasch Measurement Transactions on the Institute's website, www.rasch.org.
| Coming Rasch-related Events | |
|---|---|
| Jan. 16 - Feb. 13, 2025, Fri.-Fri. | On-line workshop: Rasch Measurement - Core Topics (E. Smith, Winsteps), www.statistics.com |
| Apr. 8 - Apr. 11, 2026, Wed.-Sat. | National Council for Measurement in Education - Los Angeles, CA, ncme.org/events/2026-annual-meeting |
| Apr. 8 - Apr. 12, 2026, Wed.-Sun. | American Educational Research Association - Los Angeles, CA, www.aera.net/AERA2026 |
| May. 15 - June 12, 2026, Fri.-Fri. | On-line workshop: Rasch Measurement - Core Topics (E. Smith, Winsteps), www.statistics.com |
| June 19 - July 25, 2026, Fri.-Sat. | On-line workshop: Rasch Measurement - Further Topics (E. Smith, Winsteps), www.statistics.com |
The URL of this page is www.rasch.org/rmt/rmt131e.htm
Website: www.rasch.org/rmt/contents.htm