With pre-calibrated items, only three items are needed to obtain useful estimates of population means on the same measurement scale as the items. Once a population mean is located relative to a set of known item calibrations, the population mean in raw score units on an entire instrument can also be determined. For studies in which the population parameters (measures or scores) are the main point of interest, this can mean huge savings in terms of time and money.
How is it possible to estimate population parameters without administering a complete instrument to a large sample? Data collected during the development of the Universal Nonverbal Intelligence Test (UNIT; Bracken & McCallum, 1997) and the Stanford-Binet Intelligence Test: Fourth Edition (Thorndike, Hagen, & Sattler, 1996) was used to investigate this question.
Any pair of items contains information about a population that answers them. Here is the performance of 9-year-olds on items 16 and 19 from the UNIT:
| Item 19 | |||
| Right: 1 | Wrong: 0 | ||
| Item 16 | Right: 1 |
178=S11 | 35=S10 |
| Wrong: 0 |
76=S01 | 68=S00 | |
If most individuals in a population fail the pair of items, S00, then the population mean is expected to be lower than the difficulty of the two items. Likewise, if the majority of a population pass a pair of items, S11, then the population mean is expected to be higher than the difficulty of the items. Thus the ratio of S11 to S00 is related to the mean ability of the population on the entire test.
The other two cells, S10 and S10, reflect the difference in difficulty between the items. If Item 19 had been very easy and Item 16 very hard, most of the population would have fallen into cell S01. Likewise, if Item 19 were hard and item 16 easy, most of the population would have been in cell S10. In fact, the Rasch model predicts that loge(S10/S01), the log-odds
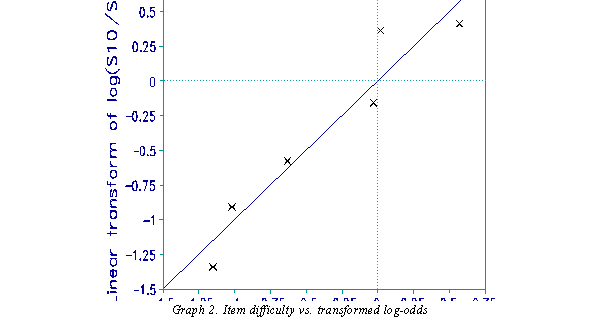
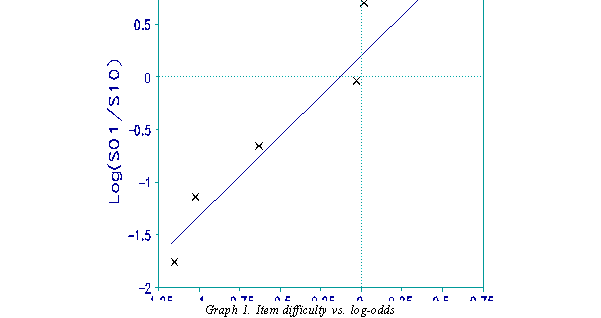
difference between the items, corresponds to their difference in difficulty. Graph 1 confirms this. Each point is the difference between the difficulty of a UNIT item and reference Item 19. The x-axis is the pre-calibration difference. The y-axis is the log-odds difference. The trace line is not the identity line because the scaling of the pre-calibrations is affected by other population and instrument characteristics. A simple linear transformation of the log-odds, however, places the points on an identity line (Graph 2).
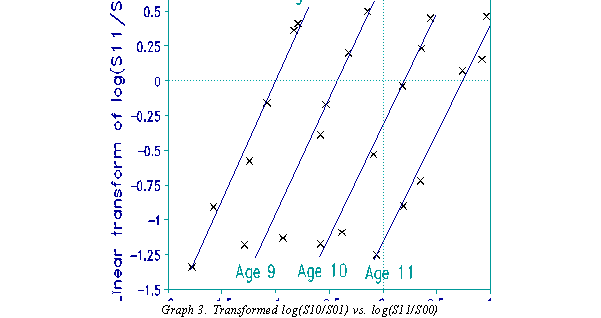
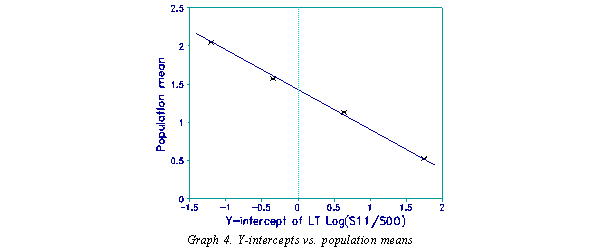
The same linear transformation is applied to the other ratio, loge(S11/S00), so that all differences are on the measurement scale of the pre-calibrated items. Once this is done, plot the item difficulty differences, pre-calibrated or transformed loge(S10/S01), against the transformed loge(S11/S00) as in Graph 3. This graph yields x-intercepts which are reflect the population means. Graph 3 shows these plots for several different populations, while Graph 4 shows how the y-intercepts are related to the population means.
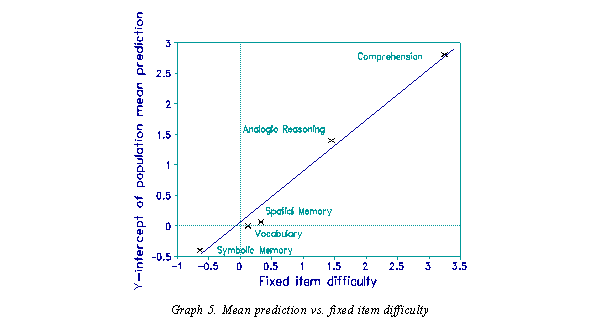
The formula for scaling the y-intercept of loge(S10/S01) versus loge(S11/S00) to the population mean is known in this case because the means are known. The slope of this line appears to be constant (m=-0.5) across multiple tests and populations. As graph 5 shows, the intercept is the difficulty of the constant item in the cross-tabs.
To summarize:
1. Administer three items from a calibrated test.
2. For two pairs of items (A,B and A,C) calculate the ratios, loge(S11/S00) and loge(S10/S01).
3. Linearly transform the two loge(S10/S01) values to equal the A-B and A-C differences.
4. Apply the same linear transformation to the two loge(S11/S00) values.
5. Estimate the y-intercept of the transformed loge(S11/S00) versus transformed loge(S10/S01) plot.
6. In our data, the y-intercept estimates the population mean as:
Kirk Becker
The Riverside Publishing Company
Bracken, B. A., & McCallum, R. S. (1998). The Universal Nonverbal Intelligence Test. Itasca, IL: Riverside.
Thorndike, R. L., Hagen, E. P., & Sattler, J. M. (1986). The StanfordBinet Intelligence Scale--Fourth edition: Technical manual. Itasca, IL: Riverside.
Three Item Testing Becker, K. … Rasch Measurement Transactions, 2000, 13:4 p. 715
| Forum | Rasch Measurement Forum to discuss any Rasch-related topic |
Go to Top of Page
Go to index of all Rasch Measurement Transactions
AERA members: Join the Rasch Measurement SIG and receive the printed version of RMT
Some back issues of RMT are available as bound volumes
Subscribe to Journal of Applied Measurement
Go to Institute for Objective Measurement Home Page. The Rasch Measurement SIG (AERA) thanks the Institute for Objective Measurement for inviting the publication of Rasch Measurement Transactions on the Institute's website, www.rasch.org.
| Coming Rasch-related Events | |
|---|---|
| May. 15 - June 12, 2026, Fri.-Fri. | On-line workshop: Rasch Measurement - Core Topics (E. Smith, Winsteps), www.statistics.com |
| June 19 - July 25, 2026, Fri.-Sat. | On-line workshop: Rasch Measurement - Further Topics (E. Smith, Winsteps), www.statistics.com |
| Aug. 31 - Sept 2 2026, Mon.-Wed. | In person: IMEKO TC1 Metrology Education and Training symposium, Klagenfurt, Austria www.photomet-edumet2026.com. Submissions by April 20 |
| Aug. 30 - Sept. 3, 2027, Mon.-Fri. | In Person: 2027 IMEKO World Congress (TC1, Tc7, TC13, TC18, TC26), Rimini, Italy imeko2027.org |
The URL of this page is www.rasch.org/rmt/rmt134a.htm
Website: www.rasch.org/rmt/contents.htm