"Possibly the most commonly collected ecological data other collections of discrete localities. On a single island, this is a check list of present and absences of species that potentially could be resident. For an entire archipelago, these data can be presented as a matrix where the vertical columns are the check lists of individual islands, with 1's for presences and 0's for absences. ... In this paper, we investigate a new method for exploring such data bases. This method collapses binary presence/absence data to summary statistics that allow both inter-archipelago and inter-taxa comparisons."
Ryti R.T., Gilpin M.E. (R&G, 1987) The comparative analysis of species occurrence patterns on archipelagos. Oecologia, 73, 282-7.
Here is the R&G model, reparameterized for clarity:

Where Rn is the row sum, the count of islands on which is found species n of N species. Ci is the column sum, the count of species found on island i of L islands.
This model is labelled a Rasch model by Bryan F.J. Manly ("A note on the analysis of species co-occurrences", Ecology, 1995, 76:4, 1109-15). In fact, we can see it is not. The left side is a log-odds expression. The right side, however, is in a probability metric. Here is the R&G model reformulated as a Rasch model, in which all terms are in a linear logit metric. It is seen to closely resemble the PROX model:
![]()
The R&G model has special interest because each coefficient is given a meaning:
"The explained variance and the proportion of occurrences in the matrix both have biological interpretations. The logistic surface that is fitted will explain 100% of the variance if and only if species occurrences can be perfectly [Guttman] ordered. Thus the explained variance, or its correlate a (alpha) in the model equation, will give an indication of the orderedness of the matrix" (p. 284).
Of course, if the data are Guttman ordered, neither form of the model is estimable. Coefficient a (alpha) is not an indication of orderliness in the data, but of targeting. If a species, found on 50% of the islands, has a 50% chance of being found on an island with 50% of the species, then 0, regardless of the ordering in the data. It is increasing sizes of ß and that reflect increasing orderliness of the data. If species were distributed binomially at random, then ß=1, gamma=1. If the distribution is close to Guttman ordered, then ß1, gammaß1.
"The proportion of 1's gives an overall indication of the colonizing ability of the species and the degree of isolation of the system of islands, with regard to the taxon under consideration. ... b (ß) gives the drop-off rate between rows [species] and c (alpha) gives the drop-off rate along columns [islands]. Thus a logical choice for the describing the dispersion of colonizing success is b/c (ß/gamma)." (p. 284)
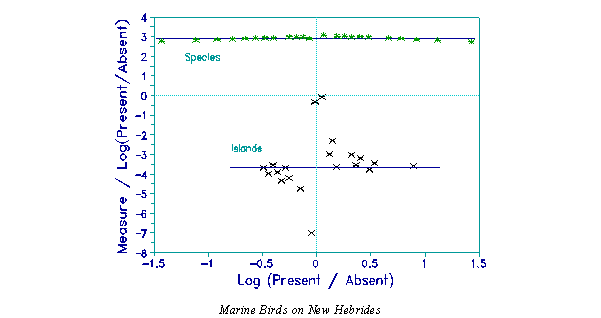
The New Hebrides plot shows the relationship between 59 species of marine birds and 28 islands of the New Hebrides from data in R&G. The x-axis is the log-odds of the presence of a bird on an island. Corresponding to each log-odds ratio, there is a Rasch measure which can be estimated in the usual way. The y-axis is the usual Rasch measure (adjusted for targeting) divided by the log-odds. Islands are analyzed as items. alpha=.2, meaning that an average island has slightly more than half the species present. ß=2.9, gamma=3.7, indicative of considerable ordering. Dispersion of colonizing success is ß/gamma=0.8.
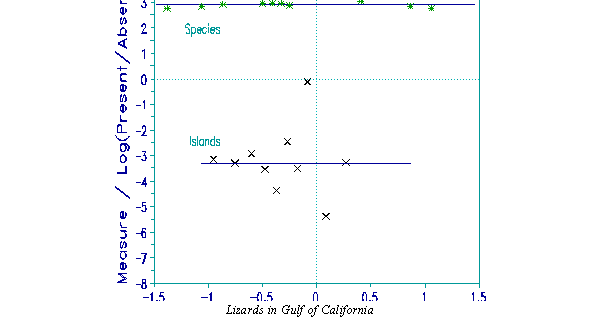
The Gulf of California plot shows the distribution of lizards on those islands (from Manly, 1995). -.8 because the average island only has 30% of the species present. ß=2.9 is as before, but 3.3 is slightly less. The data are slightly less ordered. But ß/gamm=0.9, so that the dispersion of colonizing success is slightly greater. From this perspective, there are more differences across the islands in the Gulf of California than in the New Hebrides.
John M. Linacre


Biogeography: The Ryti & Gilpin Rasch(?) Model Linacre J.M. … Rasch Measurement Transactions, 2000, 13:4 p. 726
| Forum | Rasch Measurement Forum to discuss any Rasch-related topic |
Go to Top of Page
Go to index of all Rasch Measurement Transactions
AERA members: Join the Rasch Measurement SIG and receive the printed version of RMT
Some back issues of RMT are available as bound volumes
Subscribe to Journal of Applied Measurement
Go to Institute for Objective Measurement Home Page. The Rasch Measurement SIG (AERA) thanks the Institute for Objective Measurement for inviting the publication of Rasch Measurement Transactions on the Institute's website, www.rasch.org.
| Coming Rasch-related Events | |
|---|---|
| Jan. 16 - Feb. 13, 2025, Fri.-Fri. | On-line workshop: Rasch Measurement - Core Topics (E. Smith, Winsteps), www.statistics.com |
| Apr. 8 - Apr. 11, 2026, Wed.-Sat. | National Council for Measurement in Education - Los Angeles, CA, ncme.org/events/2026-annual-meeting |
| Apr. 8 - Apr. 12, 2026, Wed.-Sun. | American Educational Research Association - Los Angeles, CA, www.aera.net/AERA2026 |
| May. 15 - June 12, 2026, Fri.-Fri. | On-line workshop: Rasch Measurement - Core Topics (E. Smith, Winsteps), www.statistics.com |
| June 19 - July 25, 2026, Fri.-Sat. | On-line workshop: Rasch Measurement - Further Topics (E. Smith, Winsteps), www.statistics.com |
The URL of this page is www.rasch.org/rmt/rmt134h.htm
Website: www.rasch.org/rmt/contents.htm