Correspondence Analysis (CA) is a way of describing data by visualization. Tables of data are converted into graphical displays, called maps, and related statistics. This parallels Rasch approaches. But there are also marked philosophical differences: "The model must follow the data, and not the other way around" proclaimed Jean-Paul Benzé, who, from the early 1960's, popularized use of CA in France. Yet Chikio Hayashi in Japan perceived CA to be an improved scaling technique to achieve the "quantification of qualitative data."
 |
| Greenacre & Blasius. Figure 1.3 (redrawn) |
A CA map of a contingency table positions both row and column labels on the same two-dimensional plot. Thus patterns that describe "persons" and "items" simultaneously can be perceived. This feature of Rasch one-dimensional person-item maps is yet more striking when seen in two dimensions.
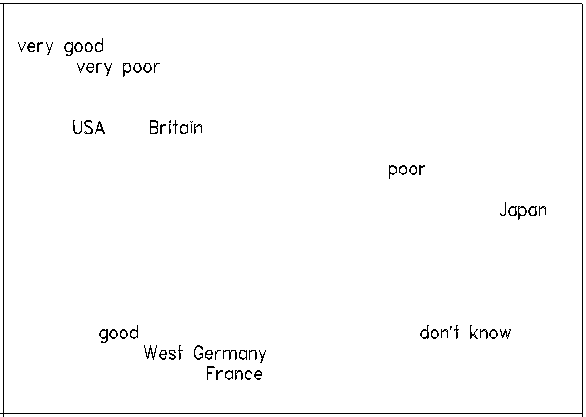
The accompanying Figure, presented as a good example of CA by Greenacre & Blasius (1994), shows that respondents in Japan chose "poor" and "don't know", while those in the USA and Britain are polarized tending to choose either "very good" and "very poor". This plot is provocative, and certainly more appealing than its underlying cross-tabulation.
But this is also a paradox within CA. It attempts to present the data as maps, with their optically-implied equal-interval scaling, but without imposing the scaling models that are required to construct that linearity. A commonly-used technique in CA is least-squares estimation, a method that implies a degree of linearity in the original data.
Other CA researchers have "some difficulty in calling CA model- free" and perceive it to construct non-linear projections of the data. For them, CA has close similarities to latent class analysis, log-linear models, principal components decomposition and Goodman's RC-association models. Here, the overlap with Rasch techniques is again obvious. For example, Rasch models can be expressed in log-linear form. Also Erling Andersen notes that Georg Rasch himself derived the RC-association model from his own polytomous model (see RMT 15:1, 803).
In practice, CA has similar strengths and weaknesses to other forms of exploratory factor analysis. The cross-plots of dimensions within the data are suggestive, but not decisive. Since there is no strong theory about the nature of the numbers used to construct the plots, alternative plots can be presented as equally valid.
CA plots, however, are exciting and intriguing. This is widening their acceptance and influence among analysts and decision-makers. Sometimes under other acronyms, such as HOMALS. This suggests that Rasch practitioners would do well to feature graphical plots of measures, instead of tables of numbers, in presentations to both technical and non-technical audiences.
Quotes from M. Greenacre and J. Blasius, "Correspondence Analysis in the Social Sciences", Academic Press, London, 1994.
Correspondence Analysis and Rasch. (2001) Linacre, J.M. … 15:3 p. 829-830
Correspondence Analysis and Rasch Linacre, J.M. … Rasch Measurement Transactions, 2001, 15:3 p. 829-830
| Forum | Rasch Measurement Forum to discuss any Rasch-related topic |
Go to Top of Page
Go to index of all Rasch Measurement Transactions
AERA members: Join the Rasch Measurement SIG and receive the printed version of RMT
Some back issues of RMT are available as bound volumes
Subscribe to Journal of Applied Measurement
Go to Institute for Objective Measurement Home Page. The Rasch Measurement SIG (AERA) thanks the Institute for Objective Measurement for inviting the publication of Rasch Measurement Transactions on the Institute's website, www.rasch.org.
| Coming Rasch-related Events | |
|---|---|
| Jan. 16 - Feb. 13, 2025, Fri.-Fri. | On-line workshop: Rasch Measurement - Core Topics (E. Smith, Winsteps), www.statistics.com |
| Apr. 8 - Apr. 11, 2026, Wed.-Sat. | National Council for Measurement in Education - Los Angeles, CA, ncme.org/events/2026-annual-meeting |
| Apr. 8 - Apr. 12, 2026, Wed.-Sun. | American Educational Research Association - Los Angeles, CA, www.aera.net/AERA2026 |
| May. 15 - June 12, 2026, Fri.-Fri. | On-line workshop: Rasch Measurement - Core Topics (E. Smith, Winsteps), www.statistics.com |
| June 19 - July 25, 2026, Fri.-Sat. | On-line workshop: Rasch Measurement - Further Topics (E. Smith, Winsteps), www.statistics.com |
The URL of this page is www.rasch.org/rmt/rmt153a.htm
Website: www.rasch.org/rmt/contents.htm