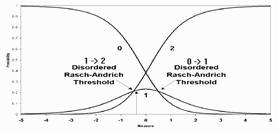
A recent paper in Medical Care¹ has raised considerable interest due to its reporting of disordered thresholds in data collected routinely in different countries from patients who have experienced a stroke.

In our work, an adjacent-category-equal-probability Rasch-Andrich threshold defines the boundary between categories, in our case of the polytomous Functional Independence Measure (FIM®)². Where thresholds are ordered, a person location between category boundaries ensures that the probability of a response in that category is larger than of any other single category³. However, if thresholds are disordered, a person location between category boundaries will not give that category the greatest probability of being observed. In our work, for example, being observed in a higher category is taken to imply higher independence. But with disordered thresholds, as in the Figure above, an observation of "2" is more likely than an observation of "1" even for a person with a measure of -0.4 (vertical arrow) which is low even for "1". Thus, from this perspective, disordering of thresholds is a violation of the measurement construct in that there is discordance between the category probabilities and the underlying trait.
Table 1. Threshold estimates for FIM motor items.
| Item Thresholds | Loc. | 1 | 2 | 3 | 4 | 5 | 6 |
| *Eating | -1.11 | 0.51 | -1.59 | -1.45 | -0.16 | 1.18 | 1.51 |
| *Grooming | -0.41 | -0.36 | -0.73 | -0.59 | -0.12 | 0.55 | 1.25 |
| Bathing | 0.39 | -1.30 | -1.10 | -0.60 | 0.12 | 0.98 | 1.91 |
| Dressing Upper Body | 0.03 | -1.09 | -0.6 | -0.28 | 0.04 | 0.54 | 1.39 |
| Dressing Lower Body | 0.47 | -1.14 | -0.46 | -0.20 | -0.02 | 0.41 | 1.41 |
| *Toileting | 0.11 | 0.09 | -0.26 | -0.34 | -0.21 | 0.12 | 0.60 |
| *Bladder Management | -0.64 | 0.95 | -0.27 | -0.34 | 0.04 | 0.19 | -0.58 |
| *Bowel Management | -0.88 | 0.70 | -0.16 | -0.35 | -0.19 | 0.02 | -0.02 |
| Transfer Bed | -0.15 | -1.28 | -0.71 | -0.29 | 0.14 | 0.68 | 1.47 |
| Transfer Toilet | -0.04 | -1.03 | -0.50 | -0.30 | -0.10 | 0.40 | 1.52 |
| *Transfer Tub | 0.80 | 0.39 | -0.84 | -0.97 | -0.39 | 0.50 | 1.31 |
| *Walk / Wheelchair | 0.24 | 0.16 | -0.15 | -0.72 | -0.96 | -0.27 | 1.95 |
| *Stairs | 1.19 | 2.15 | -0.66 | -1.73 | -1.44 | -0.14 | 1.82 |
What does disordering look like in practice, and when does it occur? Table 1 gives the estimates for the thresholds taken from the data of 895 stroke patients which formed the basis of the Medical Care paper. The analysis used the unrestricted (partial credit) model. A likelihood ratio test (p<.001) showed that the rating scale model was less suitable. The asterisked items have disordered thresholds, with the "stairs" item displaying a particularly bizarre pattern. At this stage most items misfit the model with an overall standardized mean-square item fit with mean of -0.360 and SD of 4.462, where a mean of 0 and SD of 1 is expected.
Figure 1. Category probability curves for Bathing item.
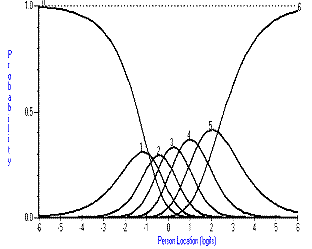
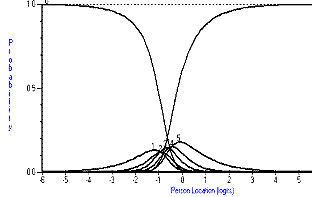
The items fall into three types with respect to their thresholds; those that are ordered; those that have one or two thresholds disordered and those where many of the thresholds are disordered. Figure 1 shows how categories should work and, in a monotonically increasing fashion, as the trait for independence increases, so does the probability of affirming a higher category. This expected relationship breaks down slightly for the eating item (Figure 2), where at no time would categories one and two be the most probable response. For the bladder management item, this relationship is largely absent, and the item would appear to be working as a dichotomy (Figure 3).
Figure 2. Category probability curves for eating item
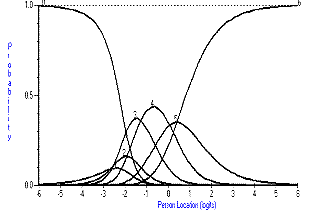
Figure 3. Category probability curves for the Bladder Management item.
How can this deviation from the expected pattern of response come about? An obvious place to start is the distribution of responses across the categories. In the Medical Care paper the analysis was based upon admission data. Might it be that many of the categories implying more independence had null or low frequencies? Table 2 shows that this was not the case, where disordered items are flagged.
Table 2. Category frequencies of FIM motor items.
| Item / Category | 1 | 2 | 3 | 4 | 5 | 6 | 7 |
| *Eating | 26 | 24 | 31 | 74 | 295 | 142 | 230 |
| *Grooming | 126 | 64 | 63 | 114 | 131 | 149 | 175 |
| Bathing | 173 | 123 | 118 | 160 | 86 | 100 | 62 |
| Dressing Upper Body | 159 | 133 | 86 | 115 | 104 | 107 | 118 |
| Dressing Lower Body | 233 | 170 | 78 | 102 | 64 | 86 | 89 |
| *Toileting | 286 | 79 | 60 | 64 | 62 | 99 | 172 |
| *Bladder Management | 171 | 39 | 44 | 49 | 68 | 70 | 379 |
| *Bowel Management | 114 | 29 | 33 | 62 | 57 | 129 | 397 |
| Transfer Bed | 123 | 110 | 111 | 138 | 82 | 129 | 129 |
| Transfer Toilet | 165 | 117 | 79 | 124 | 69 | 144 | 124 |
| *Transfer Tub | 406 | 53 | 60 | 84 | 55 | 88 | 60 |
| *Walk / Wheelchair | 292 | 69 | 41 | 50 | 83 | 181 | 85 |
| *Stairs | 581 | 14 | 11 | 26 | 58 | 92 | 32 |
Although there is a clear variation in the distribution of responses across items, all categories had sufficient numbers for estimation4. Note that the "grooming" item which is disordered, has a similar distribution (but in the opposite way) to the "bathing" item, which is ordered. Furthermore, the conditional pairwise estimation procedure employed in RUMM2020 estimates threshold parameters from all the data, not just from adjacent categories, enhancing the stability of estimates³.
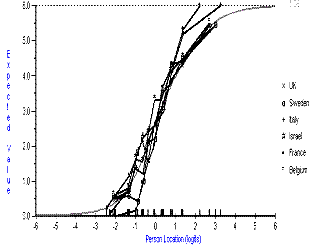
Another reason for the disordering may be that different rehabilitation facilities around Europe assign values to the FIM in different ways. Certainly there are different traditions across Europe in the way in which, for example, patients are bathed within rehabilitation facilities5. Also the extent of training varies. Two regions, Sweden and Italy have extensive training programs, yet the data from these countries was just as disordered as elsewhere. Furthermore, ordered thresholds were not necessarily associated with the absence of Differential Item Functioning (DIF) across countries. Figure 4 shows the ICC by country for the "bathing item" which was ordered. However, there was significant DIF for this item (F=10.22; p<0.001), suggesting that the expected category at any given level could vary by country across the trait.
Figure 4. Plot of ICC by country for "bathing" item.
The rating scale model has been used previously for analysis of the FIM6. Has the use of the unrestricted (partial credit model) contributed to this dilemma? Although the Loge Likelihood test shows a significant worse fit for the rating scale model, if used, the extent of disordered thresholds is greater still. Indeed, every item is disordered under the rating scale model. Thus it would seem, in this data set at least, that this is not a reason as to why disordered thresholds are more common than in previous reports.
Prior to seeking a solution to these problems, how does the total raw score reflect the change in category response across the items? At first sight, in Table 3, it would appear that there is an appropriate increase in raw score as each category increases, perhaps with just the exception of the walk/wheelchair item (this is taken from the SPSS file and includes extremes). Thus higher performing patients are rated in higher categories. However, exploratory post-hoc tests suggest that raw scores cannot discriminate across some categories in six of the eight disordered items, but can do so in all the ordered items.
Table 3. FIM average motor raw score for each category of each item.
| Item / Category | 1 | 2 | 3 | 4 | 5 | 6 | 7 |
| *Eating | 16.8 | 23.2 | 25.6 | 36.5 | 44.7 | 56.1 | 70.7 |
| *Grooming | 21.3 | 26.1 | 35.2 | 44.0 | 52.0 | 64.9 | 77.1 |
| Bathing | 23.6 | 34.8 | 42.0 | 56.3 | 68.1 | 78.1 | 86.5 |
| Dressing Upper Body | 22.1 | 32.9 | 44.1 | 52.9 | 59.4 | 71.8 | 82.2 |
| Dressing Lower Body | 25.4 | 38.7 | 48.5 | 62.6 | 67.6 | 76.3 | 85.9 |
| *Toileting | 26.1 | 38.4 | 45.8 | 55.0 | 57.7 | 70.3 | 80.1 |
| *Bladder Management | 23.5 | 32.6 | 35.6 | 37.8 | 44.0 | 51.3 | 69.2 |
| *Bowel Management | 20.0 | 28.6 | 34.4 | 35.5 | 38.7 | 52.6 | 66.8 |
| Transfer Bed | 20.4 | 30.0 | 38.8 | 48.3 | 56.4 | 72.5 | 83.1 |
| Transfer Toilet | 21.2 | 33.1 | 41.3 | 50.1 | 56.9 | 71.9 | 83.4 |
| *Transfer Tub | 34.6 | 38.4 | 48.2 | 61.5 | 70.6 | 79.5 | 87.2 |
| *Walk / Wheelchair | 28.7 | 28.6 | 37.3 | 42.3 | 54.2 | 58.9 | 84.0 |
| *Stairs | 38.5 | 56.0 | 59.2 | 63.0 | 73.1 | 81.1 | 87.0 |
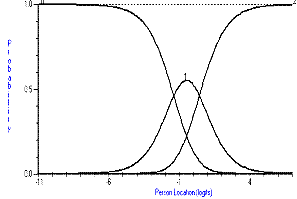
What can be done about the apparent disordering of thresholds? In the Medical Care paper we rescored items on an individual basis to try and improve fit to the model. As thresholds are estimated with respect to all categories, not just adjacent categories, the final solution was not at all obvious from the category probability curves such as those presented above. For example, the "bladder" item worked with three categories (Figure 5), while the eating item had to be dichotomized.
Figure 5. "Bladder" item after rescoring.
In the paper it was shown that the "eating", "bowel management" and "toileting" items had to be dichotomized; "bladder management" and "grooming" tritomized; "walk/wheelchair", "transfer tub" and stairs were collapsed into four categories, with the remainder working as seven category items. The paper went on to split items for DIF by country, and came up with a working solution, effectively using the FIM motor items at the county level as an item bank, linked by five common items. The final category frequencies for the rescored items are given in Table 4 (This excludes the solution after splitting for country DIF, which makes matters much more complicated; and a couple of additional patients became extreme).
Table 4. Category frequencies after rescoring.
| Item/Category | 1 | 2 | 3 | 4 | 5 | 6 | 7 |
| *Eating | 26 | 794 | |||||
| *Grooming | 126 | 521 | 173 | ||||
| Bathing | 173 | 123 | 118 | 160 | 86 | 100 | 60 |
| Dressing Upper Body | 159 | 133 | 86 | 115 | 104 | 107 | 116 |
| Dressing Lower Body | 233 | 170 | 78 | 102 | 64 | 86 | 87 |
| *Toileting | 286 | 534 | |||||
| *Bladder Management | 171 | 270 | 377 | ||||
| *Bowel Management | 114 | 705 | |||||
| Transfer Bed | 123 | 110 | 111 | 138 | 82 | 129 | 127 |
| Transfer Toilet | 165 | 117 | 79 | 124 | 69 | 144 | 122 |
| *Transfer Tub | 406 | 197 | 143 | 58 | |||
| *Walk / Wheelchair | 292 | 243 | 181 | 83 | |||
| *Stairs | 581 | 109 | 92 | 30 |
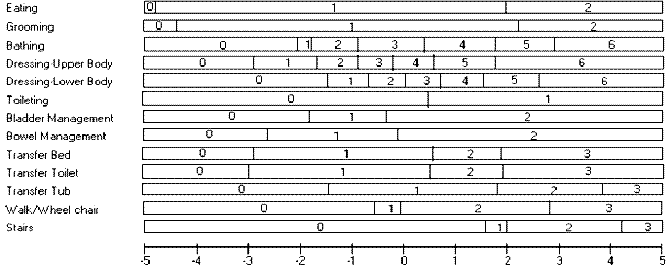
The rescoring solution we found is "messy" in that some items retain all their categories, and then there is a variable reduction in the number of categories for other items. Also, as we have seen, although there is an increase in raw score across all categories for most items, there is a suggestion from post hoc tests that the raw score cannot discriminate across some categories, and these occur where thresholds are disordered. Technically, given fit to the Rasch model, items should not be collapsed further, but prior to splitting for DIF, the case can be made that these data still do not fit the model. Furthermore, there is the issue of differential fit between countries. Single country analysis had shown different fit and different rescoring solutions. For example the UK items "transfer bed" and "transfer toilet", which were ordered in the pooled data, were collapsed into four categories for the UK analysis (Figure 6).
Figure 6. Category structure for UK FIM motor scale after rescoring.
What about the use of different software? The results produced by a parallel run with Winsteps are substantively equivalent to those shown here, being limited to minor numerical differences.
It is our contention that scales should work adequately at admission to rehabilitation services, else they should not be used for assessment purposes, or as the basis for outcome measurement. The requirement is for invariance across time. Furthermore, the scale must be invariant across any relevant clinical subtypes if data are to be pooled for the diagnostic group; across diagnostic groups if they are to be pooled at the level of the rehabilitation unit, and across countries if international comparisons are to be made.
The fact that scales work in different ways across different diagnoses and countries should not be surprising given the recent insights provided by modern psychometric methods. The Medical Care paper demonstrated that despite cultural variations, a solution could be found that facilitated the pooling of data. Should we then be so worried about the lack of invariance for some items given we now have the technology to accommodate such variations?
The issue of the disordered thresholds may warrant further effort on the part of FIM users. This involves two aspects; the fundamental aspect of whether or not disordered thresholds are to be taken seriously as a violation of measurement; and the practical aspect of achieving a solution which is common across countries (and the same applies to diagnoses, or within country centers). This will require some clear thinking as to what such disordering means for clinical practice, for outcome measurement, and the pooling of data of the kind undertaken at Buffalo. Given the extent of the FIM database held in Buffalo, at least this is one outcome scale where the users have the capacity to investigate these matters thoroughly, from a well established database. Alan Tennant BA, PhD. Professor of Rehabilitation Studies, The University of Leeds, UK.
References: 1. Tennant A, Penta M, Tesio L, Grimby G, Thonnard J-L, Slade A, Lawton G, Simone A, Carter J, Lundgren-Nilsson A, Tripolski M, Ring H, Biering-Sorensen F, Marincek C, Burger H, Phillips S. Assessing and adjusting for cross cultural validity of impairment and activity limitation scales through Differential Item Functioning within the framework of the Rasch model : the Pro-ESOR project. Medical Care 2004; 42: (Supple 1) 37-48 2. Keith RA, Granger CV, Hamilton BB, Sherwin FS. The functional independence measure: A new tool for rehabilitation. In: Eisenberg MG, Grzesiak RC (Eds): Advances in Clinical Rehabilitation. New York, Springer Publishing Co; Vol. 1. p. 6-18; 1987. 3. Andrich D, Luo G. Conditional pairwise estimation in the Rasch model for ordered responses using principal components. J Applied Measurement 2003; 4:205-221. 4. Linacre JM. Investigating rating scale category utility. J Outcome Measurement 1999; 3:103-122. 5. Kucukdeveci AA, Yavuzer G, Ehan AH, Sonel B, Tennant A. Adaptation of the Functional Independence Measure for use in Turkey. Clinical Rehabil 2001; 15:311-319. 6. Grimby G , Andraon E , Holmgren E , Wright B , Linacre JM , Sundh V. Structure of a combination of Functional Independence Measure and Instrumental Activity Measure items in community-living persons: a study of individuals with cerebral palsy and spina bifida. Arch Phys Med Rehabil, 1996; 77(11): 1109-14.
Disordered Thresholds: An example from the Functional Independence Measure, Tennant A. … Rasch Measurement Transactions, 2004, 17:4 p.945-948
| Forum | Rasch Measurement Forum to discuss any Rasch-related topic |
Go to Top of Page
Go to index of all Rasch Measurement Transactions
AERA members: Join the Rasch Measurement SIG and receive the printed version of RMT
Some back issues of RMT are available as bound volumes
Subscribe to Journal of Applied Measurement
Go to Institute for Objective Measurement Home Page. The Rasch Measurement SIG (AERA) thanks the Institute for Objective Measurement for inviting the publication of Rasch Measurement Transactions on the Institute's website, www.rasch.org.
| Coming Rasch-related Events | |
|---|---|
| Jan. 16 - Feb. 13, 2025, Fri.-Fri. | On-line workshop: Rasch Measurement - Core Topics (E. Smith, Winsteps), www.statistics.com |
| Apr. 8 - Apr. 11, 2026, Wed.-Sat. | National Council for Measurement in Education - Los Angeles, CA, ncme.org/events/2026-annual-meeting |
| Apr. 8 - Apr. 12, 2026, Wed.-Sun. | American Educational Research Association - Los Angeles, CA, www.aera.net/AERA2026 |
| May. 15 - June 12, 2026, Fri.-Fri. | On-line workshop: Rasch Measurement - Core Topics (E. Smith, Winsteps), www.statistics.com |
| June 19 - July 25, 2026, Fri.-Sat. | On-line workshop: Rasch Measurement - Further Topics (E. Smith, Winsteps), www.statistics.com |
The URL of this page is www.rasch.org/rmt/rmt174a.htm
Website: www.rasch.org/rmt/contents.htm