The Web Index (WI), developed by the World Wide Web Foundation and launched in September 2012, aims at measuring the impact of the Web on people and nations. It is computed for 61 countries worldwide and consists of 85 indicators across 7 components: Communications Infrastructure, Institutional Infrastructure, Web Content, Web Use, Political Impact, Economic Impact and Social Impact of the Web (Farhan et al., 2012). The WI combines both existing hard data, from official providers, and new data gathered via a multi-country questionnaire - primary data - specifically designed by the Web Foundation and its advisers. The questionnaire was submitted to country experts for the first release of the Index. It consists of 63 questions each on a 1 to 10 scale, positively oriented with respect to the Web impact level. The scores given by country experts were checked and verified by a number of peer and regional reviewers for each country.
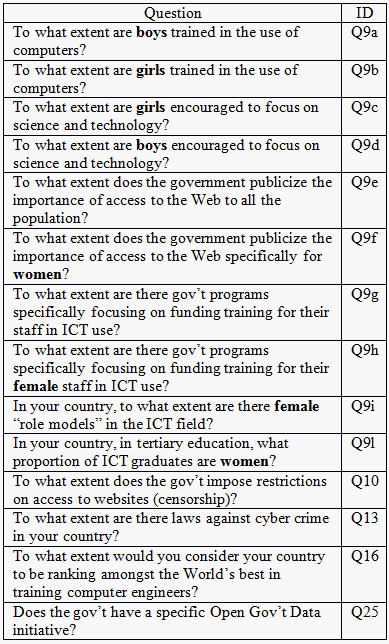
Table 1: List of original questions
|
|---|
Rating Scale Model for primary data
Primary data are the backbone of the WI. Our analysis on primary data aimed at highlighting possible improvements of the questionnaire used to collect primary data and detecting specific behaviours both for countries and questions. To this purpose the Rating Scale model is employed for each of the components separately (Annoni et al., 2012). The focus here is on one WI component, the Institutional Infrastructure, which "looks at extent to which institutions, organizations and government support and promote the Web access, and the extent to which information about their organizations is made available on the Web" (Farhan et al., 2012, pg. 23). This component is then of fundamental importance in measuring the Web Impact and is the only one including eight questions aimed at highlighting possible gender imbalances. Table 1 lists of questions included in this component.
The Rating Scale Model revealed that questions Q10 and Q25 had poor fit characteristics, with infit and outfit statistics > 2. These questions were excluded from further analysis. In the final Rating Scale Model all the questions showed good fit statistics. The Rasch model explains about 62% of data variability and evidences a clearly unidimensional construct. The response structure organised in a ten category scale was evidenced to be appropriate, as no country shows a notable unexpected pattern of answers, confirming that the questionnaire has been always scored by experts at their best. However, DIF analyses reveal a gender bias issue.
Is there a gender-bias issue?
By comparing the locations of questions Q9a - Q9b, which describe computer training for boys and girls, and Q9c - Q9d, describing science and technology training for girls and boys, we notice that the ones referring to boys (Q9a and Q9d) are easier than their female counterparts. Moreover, the most difficult questions all refer to the female situation, clearly raising a gender bias issue.
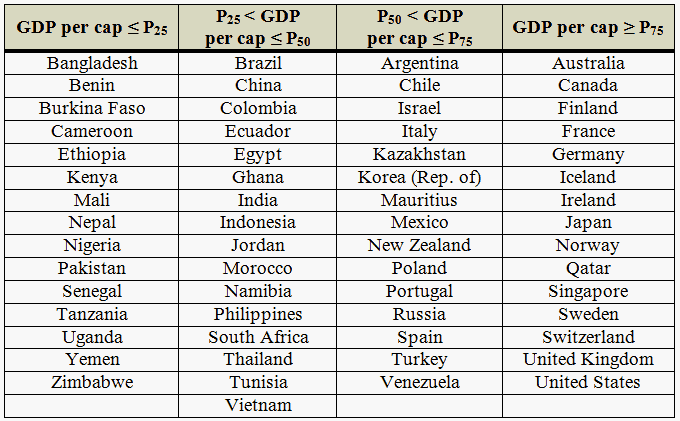
Table 2: Countries included in the analysis classified according to GDP per capita in PPS.
|
|---|
A DIF analysis is also performed on groups of countries defined on the basis of GDP per capita in PPS (according to the International Monetary Fund). Countries are classified according to the quartiles of the distribution of the country average GDP per capita over the period 2008-2012 (Table 2). The analysis shows that question Q9d (boys' training on science and technology) performs differentially for the richest ( > P75) and the poorest countries ( = P25). Question Q9l (share of female ICT graduates) performs differentially for the richest countries (Table 3). Scores on question Q9d, higher than expected in the poorest countries, indicate that in these countries
boys are particularly encouraged to focus on science and technology. The opposite occurs for the richest countries, suggesting a gender-bias issue which is more relevant in the poorest countries than in the richest ones. Scores on question Q9l are lower than expected in richest countries, indicating a lower attitude of girls towards ICT degrees in these countries than expected by the model. This suggests that even in the richest countries the ICT sector needs to attract more women, with all the implications that this may have. A participation discrepancy between genders in science, technology and ICT topics has been recently highlighted in the European Member States (DG- EMPL, 2010), where stereotypical assumptions about IT-related jobs still play a significant role. Does our analysis agree with this? Awkwardly, we think so.
| Table 3: DIF outcomes for different groups of countries. | ||||
|---|---|---|---|---|
| Component | Country Group | Q | Q-Difficulty | Scores |
| Institutional infrastructure | Poorest | Q9d | < than expected | > than expected |
| Richest | Q9d | < than expected | > than expected | |
| Richest | Q9l | < than expected | > than expected | |
Paola Annoni & Dorota Weziak-Bialowolska
JRC - European Commission, Unit of Econometrics and Applied Statistics, Ispra, Italy
References
Annoni P., Weziak-Bialowolska D., Nardo M. (2012) Assessment of the Web Index: Survey questionnaire calibration and uncertainty analysis. EUR 25476 Luxembourg: Publications Office of the European Union. http://composite-indicators.jrc.ec.europa.eu
DG-EMPL (2010) More women in senior positions - key to economic stability and growth. European Commission, Directorate-General for Employment, Social Affairs and Equal Opportunities. www.eubusiness.com/topics/employment/women-senior.10
Farhan H., D'Agostino D., Worthington H. (2012) Web Index 2012. World Wide Web Foundation, www.webfoundation.org/projects/the-web-index/.
The Web Index: Gender Bias Findings from the Rating Scale model. Paola Annoni & Dorota Weziak-Bialowolska … Rasch Measurement Transactions, 2012, 26:3 p. 1389-90
| Forum | Rasch Measurement Forum to discuss any Rasch-related topic |
Go to Top of Page
Go to index of all Rasch Measurement Transactions
AERA members: Join the Rasch Measurement SIG and receive the printed version of RMT
Some back issues of RMT are available as bound volumes
Subscribe to Journal of Applied Measurement
Go to Institute for Objective Measurement Home Page. The Rasch Measurement SIG (AERA) thanks the Institute for Objective Measurement for inviting the publication of Rasch Measurement Transactions on the Institute's website, www.rasch.org.
| Coming Rasch-related Events | |
|---|---|
| Jan. 16 - Feb. 13, 2025, Fri.-Fri. | On-line workshop: Rasch Measurement - Core Topics (E. Smith, Winsteps), www.statistics.com |
| Apr. 8 - Apr. 11, 2026, Wed.-Sat. | National Council for Measurement in Education - Los Angeles, CA, ncme.org/events/2026-annual-meeting |
| Apr. 8 - Apr. 12, 2026, Wed.-Sun. | American Educational Research Association - Los Angeles, CA, www.aera.net/AERA2026 |
| May. 15 - June 12, 2026, Fri.-Fri. | On-line workshop: Rasch Measurement - Core Topics (E. Smith, Winsteps), www.statistics.com |
| June 19 - July 25, 2026, Fri.-Sat. | On-line workshop: Rasch Measurement - Further Topics (E. Smith, Winsteps), www.statistics.com |
The URL of this page is www.rasch.org/rmt/rmt263g.htm,
Website: www.rasch.org/rmt/contents.htm,