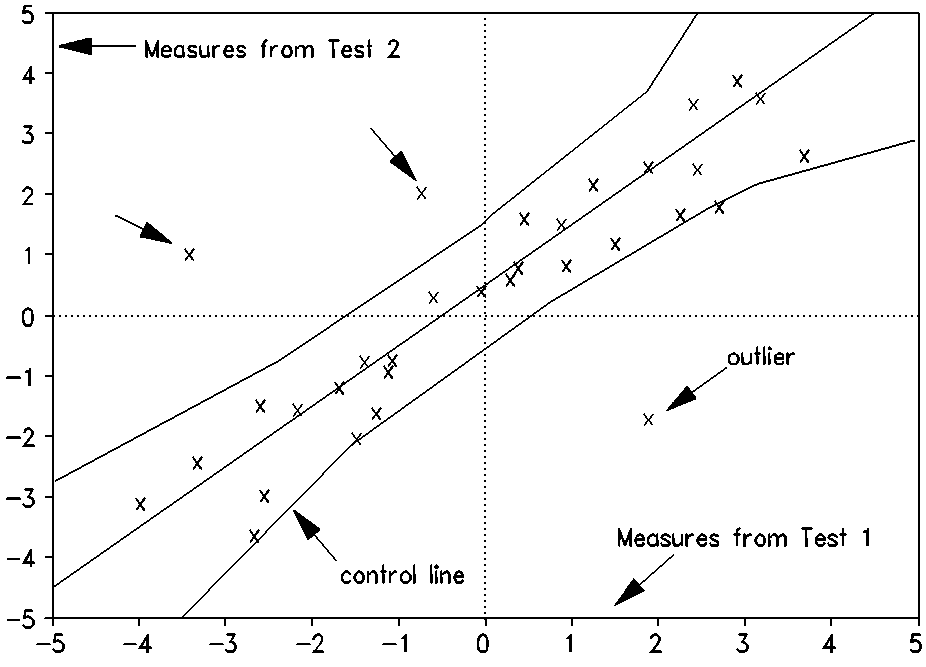
Perhaps you have measured a group of people on a certain scale and you measure them again with the same instrument at a later time. Did the instrument function the same way both times? Perhaps some people took two alternate forms of the same test. Are the forms equivalent? Perhaps two tests share common items. Do the items function the same way in each test (DIF: Differential Item Functioning)? Or perhaps you have two groups of people that took the same test. Are any items biased?
A glance at a simple graph can give you the answer. Merely plot the pairs of person measures or pairs of item calibrations against each other, draw in the identity line, and construct control lines for the confidence interval you want. If all data points lie within the control lines - joy and bliss! If many data points lie without the control lines - sorrow and think again!
 |
| Plot of measures with confidence intervals |
|---|
Plotting is simple to do by hand. But it is neater, and more accurate to have your computer do it for you. Here's the idea: call a typical matching pair of measures from the two analyses D1 and D2, with standard errors SE1 and SE2.
1. Calculate the mean of the set of D1's = MEAN1, and the mean of D2's set = MEAN2.
2. Look up the Z-score for the confidence interval you want, e.g. Z=1.96 for 95%; Z=2.6 for 99%.
3. For each matching pair of measures, calculate the joint standard error: SE12 = sqrt(SE1^2 + SE2^2)
4. For each matching pair of measures, calculate points on the two
control lines:
UPPER1 = (D1+D2)/2 + MEAN1 - Z*SE12/2
UPPER2 = (D1+D2)/2 + MEAN2 + Z*SE12/2
LOWER1 = (D1+D2)/2 + MEAN1 + Z*SE12/2
LOWER2 = (D1+D2)/2 + MEAN2 - Z*SE12/2
5. Plot D1 against D2, as points, for the data points.
6. For the identity line, draw a line from (MEAN1-5,MEAN2-5) to (MEAN1+5,MEAN2+5).
7. Sort the (UPPER1,UPPER2) pairs into ascending order, and plot UPPER1 against UPPER2, as lines (smoothed if possible), for the upper control line.
8. Sort the (LOWER1,LOWER2) pairs into ascending order, and plot LOWER1 against LOWER2, as lines (smoothed if possible), for the lower control line.
9. Now get to work on those rascally data points lying outside the control lines!
Graphical Diagnosis, S Luppescu … Rasch Measurement Transactions, 1991, 5:1 p. 136
| Forum | Rasch Measurement Forum to discuss any Rasch-related topic |
Go to Top of Page
Go to index of all Rasch Measurement Transactions
AERA members: Join the Rasch Measurement SIG and receive the printed version of RMT
Some back issues of RMT are available as bound volumes
Subscribe to Journal of Applied Measurement
Go to Institute for Objective Measurement Home Page. The Rasch Measurement SIG (AERA) thanks the Institute for Objective Measurement for inviting the publication of Rasch Measurement Transactions on the Institute's website, www.rasch.org.
| Coming Rasch-related Events | |
|---|---|
| Jan. 16 - Feb. 13, 2025, Fri.-Fri. | On-line workshop: Rasch Measurement - Core Topics (E. Smith, Winsteps), www.statistics.com |
| Apr. 8 - Apr. 11, 2026, Wed.-Sat. | National Council for Measurement in Education - Los Angeles, CA, ncme.org/events/2026-annual-meeting |
| Apr. 8 - Apr. 12, 2026, Wed.-Sun. | American Educational Research Association - Los Angeles, CA, www.aera.net/AERA2026 |
| May. 15 - June 12, 2026, Fri.-Fri. | On-line workshop: Rasch Measurement - Core Topics (E. Smith, Winsteps), www.statistics.com |
| June 19 - July 25, 2026, Fri.-Sat. | On-line workshop: Rasch Measurement - Further Topics (E. Smith, Winsteps), www.statistics.com |
The URL of this page is www.rasch.org/rmt/rmt51j.htm
Website: www.rasch.org/rmt/contents.htm