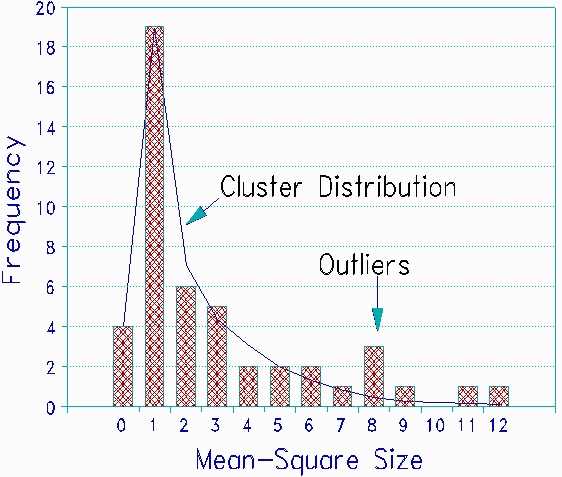
An investigation of item fit is central to the selection of items. Item misfit to the Rasch model can be summarized in mean-square statistics. Associated with each mean-square is a significance level based on a test of the hypothesis: "Responses to this item fit the model perfectly." All significance tests, however, are sensitive to sample size. While power in significance testing can be worthwhile, "too much power" due to exceedingly large samples may lead to faulty conclusions about item fits.
Experimental versions of an anatomy examination were administered to 4998 individuals. Due to the resulting power of the hypothesis test, 29 of 47 items showed significant statistical misfit (p<.05), creating the impression that many items were unusable. Though each item will ultimately be examined for other aspects of quality, such as discrimination and guessing, it is useful to have a more realistic indication of fit and misfit than the conventional significance levels.
A first step is to examine how the mean-square values distribute. This distribution provides insight into whether or not the items are functioning in a similar way. In a histogram of the mean-square statistics we expect a pattern in which many statistics are clustered around a central location (near 1.0) while others are "outliers". Items in the cluster are exhibiting similar fit. Outliers are divergent. When the mean-square fit statistics for the anatomy items are plotted, the expected cluster emerges near 1. This cluster includes all the "good" fit items, based on their statistical significance, and half of the "bad" items. Since the mean-squares are ratio scale statistics, the "cluster distribution" drawn into the Figure was obtained by fitting a smooth symmetric curve to the logarithms of the mean-squares, and exponentiating back to the ratio scaling.
This result does not mean that all items in the cluster should be immediately accepted into the final version of the examination. Nor does it mean that those outside the cluster be rejected. Rather this information provides an orderly basis for choosing final item sets.
 |
| Mean-square distribution |
|---|
Mean-square Significance and Sample Size, P Halkitis … Rasch Measurement Transactions, 1992, 6:3 p. 227-8
| Forum | Rasch Measurement Forum to discuss any Rasch-related topic |
Go to Top of Page
Go to index of all Rasch Measurement Transactions
AERA members: Join the Rasch Measurement SIG and receive the printed version of RMT
Some back issues of RMT are available as bound volumes
Subscribe to Journal of Applied Measurement
Go to Institute for Objective Measurement Home Page. The Rasch Measurement SIG (AERA) thanks the Institute for Objective Measurement for inviting the publication of Rasch Measurement Transactions on the Institute's website, www.rasch.org.
| Coming Rasch-related Events | |
|---|---|
| Jan. 16 - Feb. 13, 2025, Fri.-Fri. | On-line workshop: Rasch Measurement - Core Topics (E. Smith, Winsteps), www.statistics.com |
| Apr. 8 - Apr. 11, 2026, Wed.-Sat. | National Council for Measurement in Education - Los Angeles, CA, ncme.org/events/2026-annual-meeting |
| Apr. 8 - Apr. 12, 2026, Wed.-Sun. | American Educational Research Association - Los Angeles, CA, www.aera.net/AERA2026 |
| May. 15 - June 12, 2026, Fri.-Fri. | On-line workshop: Rasch Measurement - Core Topics (E. Smith, Winsteps), www.statistics.com |
| June 19 - July 25, 2026, Fri.-Sat. | On-line workshop: Rasch Measurement - Further Topics (E. Smith, Winsteps), www.statistics.com |
The URL of this page is www.rasch.org/rmt/rmt63a.htm
Website: www.rasch.org/rmt/contents.htm