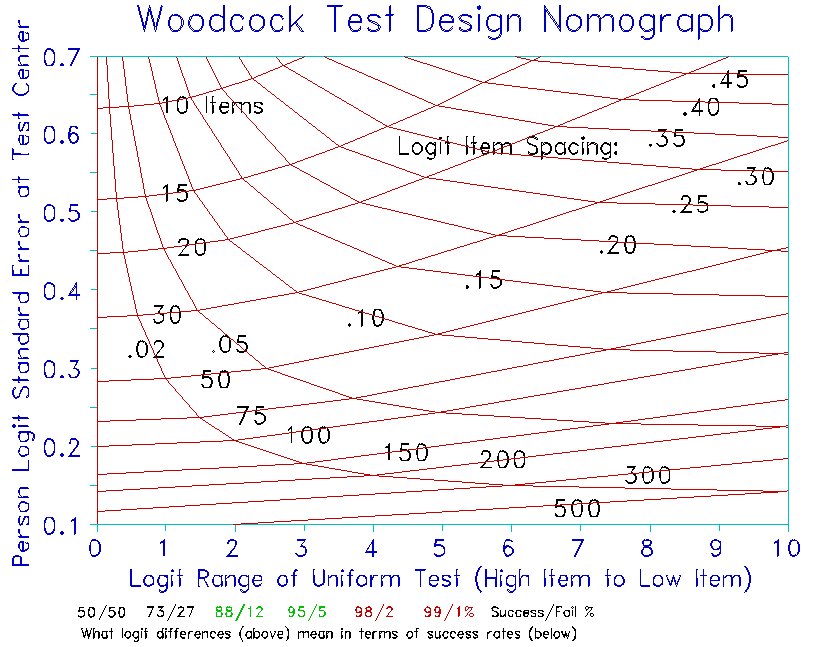
Woodcock's test design nomograph helps construct dichotomous tests. It was designed by Richard Woodcock in 1975 as a quick way of discovering the characteristics of a test needed to meet particular measurement objectives.
Woodcock perceived that the spread of items in a test can usually be approximated by a uniform distribution. The nomograph shows how four aspects of item distribution for a uniform test relate: 1) the range of item difficulties (from easiest to hardest), 2) the number of items in the test, 3) the spacing between items, and 4) the precision of measurement (standard error) at the center of the test. A reminder of what particular logit values mean in terms of expected success rates is printed below the X-axis.
On this nomograph, the difference in logit difficulty between the
highest (Dh) and lowest items (Dl) is shown as the logit range (Dh-Dl)
on the X-axis. Since the tails of the test may be irregular, it may
be more meaningful to average in the next to highest and next to
lowest items, Dh-1 and Dl-1. Thus, for a test of L items,
Logit Range = ((Dh-Dl) + (Dh-1-Dl-1)*(L-1)/(L-3))/2
The Y-axis shows the measurement precision for a person with ability at the center of the test. These ideas are explained in Wright BD & Stone MH (1979) Best Test Design, p. 143-151.
Two sets of contour lines are provided. One set indicates tests of equal length (having the same number of items). The other set indicates tests of equal density (having the same number of items per logit of the difficulty range).
Example: A test covers 4 logits. We want to measure targeted persons
with precision 0.3 logits. How many items are required?
Look up from the X-axis at 4 logits, across from the Y-axis at 0.3
logits. The test length is between 50 and 75 items, at about 60
items. This gives a uniform item spacing of 1 item for every .07
logits along the variable.
Example: We are constructing a test with a an item difficulty range of
3 logits. There are 75 items. How precise are the measures for
targeted students?
Look up from the X-axis at 3 logits, until you meet the contour line
for 75 items. The precision indicated on the Y-axis is 0.25 logits.
 |
Richard Woodcock's Test Construction Nomograph, R Woodcock … Rasch Measurement Transactions, 1992, 6:3 p. 243-4
| Forum | Rasch Measurement Forum to discuss any Rasch-related topic |
Go to Top of Page
Go to index of all Rasch Measurement Transactions
AERA members: Join the Rasch Measurement SIG and receive the printed version of RMT
Some back issues of RMT are available as bound volumes
Subscribe to Journal of Applied Measurement
Go to Institute for Objective Measurement Home Page. The Rasch Measurement SIG (AERA) thanks the Institute for Objective Measurement for inviting the publication of Rasch Measurement Transactions on the Institute's website, www.rasch.org.
| Coming Rasch-related Events | |
|---|---|
| Jan. 16 - Feb. 13, 2025, Fri.-Fri. | On-line workshop: Rasch Measurement - Core Topics (E. Smith, Winsteps), www.statistics.com |
| Apr. 8 - Apr. 11, 2026, Wed.-Sat. | National Council for Measurement in Education - Los Angeles, CA, ncme.org/events/2026-annual-meeting |
| Apr. 8 - Apr. 12, 2026, Wed.-Sun. | American Educational Research Association - Los Angeles, CA, www.aera.net/AERA2026 |
| May. 15 - June 12, 2026, Fri.-Fri. | On-line workshop: Rasch Measurement - Core Topics (E. Smith, Winsteps), www.statistics.com |
| June 19 - July 25, 2026, Fri.-Sat. | On-line workshop: Rasch Measurement - Further Topics (E. Smith, Winsteps), www.statistics.com |
The URL of this page is www.rasch.org/rmt/rmt63p.htm
Website: www.rasch.org/rmt/contents.htm