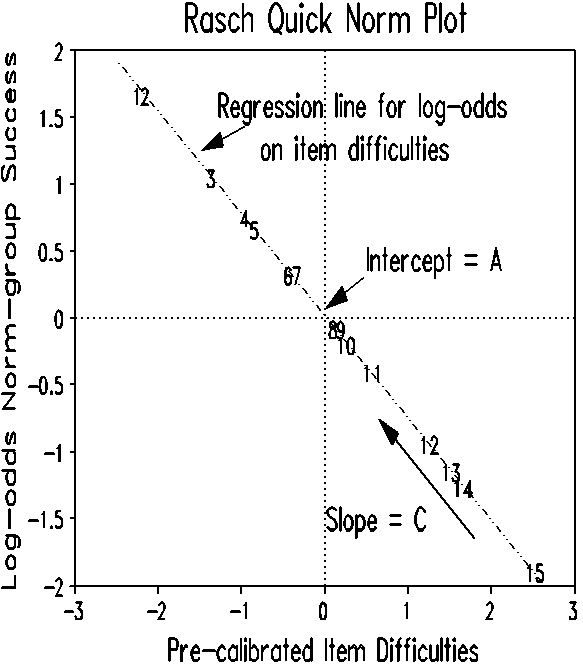
Norm-referenced interpretation compares an examinee's performance on a test with the distribution of performances of a reference population. Consequently, estimates of the mean and standard deviation of the reference population are the key ingredients to norming. Rasch theory provides an easy method to develop "quick norms" using only two pieces of information: a set of items with pre-calibrated difficulties, and the number of examinees in the reference group (representing the reference population) who succeeded on each item.
The quick norm procedure employs Cohen's PROX technique (Wright &
Stone 1979 p. 126-128):
(1) Select a set of items whose pre-calibrated item difficulties span
the expected range of abilities.
(2) Administer the set of items to a reference group.
(3) Count up the correct responses to each item.
(4) Calculate the log-odds = loge(number correct / number incorrect)
for each item.
(5) Plot the log-odds against the item difficulty for each item.
Verify they fall on a "statistical" line. Amend the items or reference
sample, if necessary.
(6) Regress the log-odds on the item difficulties.
Obtain
A = Intercept at 0 item difficulty
C = Slope of line.
(7) Reference population mean = A/C
(8) Reference population S.D. = 1.7*sqrt[(1-C^2)/C^2]
(9) Compute the measure for each possible raw score on the item set,
or measure each new examinee using some or all of the item set.
(10) Compute norm-referenced indicators (percentiles, standard scores)
using the computed measures and the reference population mean and S.D.
 |
The Table summarizes the responses of 50 examinees to 15 pre- calibrated items. A plot of the log-odds correct answers against the item difficulties is shown in the Figure. The intercept of the least-squares regression line corresponds is "A" and the slope is "C".
               Rasch Quick Norms (N = 50 examinees)
Items    Examinees    Log-odds correct:  Pre-calibrated item
       succeeding: Si  loge(Si /(N-Si))    difficulty: Di
 1          42               1.66             -2.19
 2          42               1.66             -2.19
 3          37               1.05             -1.34
 4          34                .75              -.94
 5          33                .66              -.82
 6          29                .32              -.36
 7          29                .32              -.36
 8          24               -.08               .17
 9          24               -.08               .17
10          23               -.16               .27
11          20               -.41               .59
12          14               -.94              1.27
13          12              -1.15              1.53
14          11              -1.27              1.67
15           6              -1.99              2.54
                      Mean = 0.02       Mean = 0.00
                      S.D. = 1.03       S.D. = 1.34
Regression Intercept = A = 0.02
Regression Slope = C = 0.77
Reference (Norm) Mean = A/C = 0.02/0.77 = 0.03
Reference (Norm) S.D. = 1.7*sqrt[(1-C^2)/C^2] = 1.43
|
An examinee who scores 13 on this 15 item test has a measure of about 1.4 logits. The z-score is (1.4 - 0.03)/1.43 = 1.0. The T-score is 60, NCE is 70, percentile is 85%, and stanine is 7.
Quick norms efficiently replace cumbersome traditional test norming methods. Bush & Schumacker (1993) generated 100 replications of simulated data for all combinations of item difficulty distribution (normal and uniform), test length (10, 20, 30, 40, 50 items), and sample size (50, 100, 200, 300, 400 examinees). They discovered no statistically significant differences between the quick norm and conventional norming methods except for the very short 10-item tests.
Bush M.J., Schumacker, R.E. (1993). Quick norms with Rasch measurement. Paper presented at AERA Annual Meeting, Atlanta.
Schumacker RE, Bush MJ. (1993) Quick norms. Rasch Measurement Transactions, 7:1 p.270-1.
Wright B.D. Stone, M.H. (1979). Best Test Design. Chicago: MESA Press.
Quick norms. Schumacker RE, Bush MJ. … Rasch Measurement Transactions, 1993, 7:1 p.270
| Forum | Rasch Measurement Forum to discuss any Rasch-related topic |
Go to Top of Page
Go to index of all Rasch Measurement Transactions
AERA members: Join the Rasch Measurement SIG and receive the printed version of RMT
Some back issues of RMT are available as bound volumes
Subscribe to Journal of Applied Measurement
Go to Institute for Objective Measurement Home Page. The Rasch Measurement SIG (AERA) thanks the Institute for Objective Measurement for inviting the publication of Rasch Measurement Transactions on the Institute's website, www.rasch.org.
| Coming Rasch-related Events | |
|---|---|
| Jan. 16 - Feb. 13, 2025, Fri.-Fri. | On-line workshop: Rasch Measurement - Core Topics (E. Smith, Winsteps), www.statistics.com |
| Apr. 8 - Apr. 11, 2026, Wed.-Sat. | National Council for Measurement in Education - Los Angeles, CA, ncme.org/events/2026-annual-meeting |
| Apr. 8 - Apr. 12, 2026, Wed.-Sun. | American Educational Research Association - Los Angeles, CA, www.aera.net/AERA2026 |
| May. 15 - June 12, 2026, Fri.-Fri. | On-line workshop: Rasch Measurement - Core Topics (E. Smith, Winsteps), www.statistics.com |
| June 19 - July 25, 2026, Fri.-Sat. | On-line workshop: Rasch Measurement - Further Topics (E. Smith, Winsteps), www.statistics.com |
The URL of this page is www.rasch.org/rmt/rmt71d.htm
Website: www.rasch.org/rmt/contents.htm