"Nearly twenty years after Sato introduced his caution index,
person-fit statistics still seem to be in the realm of
potential...
* The research has been largely unsystematic,
* The research has been largely atheoretical,
* The research has not explored... applied settings."
Rudner et al., 1995, p.23
The problem of idiosyncratic responses has long been known: "one must expect that some subjects will do their task in a perfunctory or careless manner... [or] fail to understand the experiment or fail to read the... instructions carefully... It has seemed desirable, therefore, to set up some criterion by which we could identify those individual records which were so inconsistent that they should be eliminated from our calculations." (Thurstone & Chave, 1929, p.32-33). But general acceptance of useful person misfit criterion has been slow in coming.
Devised in 1975, Sato's caution index quantifies deviations from Guttman ordering: "The basic condition to be satisfied is that persons who answer a question `favorably' all have higher scores than persons answering the same question `unfavorably'" (Guttman, 1950, p.76-77). Guttman notes that this permits person response diagnosis: "Scale analysis can actually help pick out responses that were correct by guessing from an analysis of the pattern of errors" (Guttman, 1950, p. 81). A deficiency in Sato's approach, however, is insensitivity to item spacing. Items of equal difficulty cannot be Guttman ordered and so raise the caution index in a way irrelevant to person misfit. Another deficiency is Sato's requirement to group persons by total score. This makes Sato's index incalculable when there are missing data.
Rudner et al. credit Wright (1977) with identifying a wide range of potential sources for idiosyncratic responses: "guessing, cheating, sleeping, fumbling, plodding, and cultural bias". Wright and his students are also credited with two stochastically-based solutions to the fit index problem, the statistics now known as INFIT and OUTFIT, whose distributional properties have been exhaustively investigated and reported by Richard Smith (1986, 1991).
After discussing these and various other indices, Rudner et al. chose INFIT, an information-weighted statistic, for their analysis of the NAEP data, but with probabilities computed from the reported person "plausible values" (= theta estimates with their error distributions) and 3-P item parameter estimates.
Rudner chooses INFIT because it
a) "is most influenced by items of median difficulty."
See "Chi-square fit statistics" (RMT 8:2 p. 360-361, 1994) for
examples of INFIT and OUTFIT behavior.
b) "has a standardized distribution".
INFIT approximates a mean-square distribution (chi^2/d.f.) with
expectation 1.0. Departure from 1.0 measures the proportion of
excess (or deficiency) in data stochasticity. Rudner's criterion
of 1.20 rejects response strings manifesting more than 20%
unmodelled noise.
c) "has been shown to be near optimal in identifying spurious scores at the ability distribution tails."
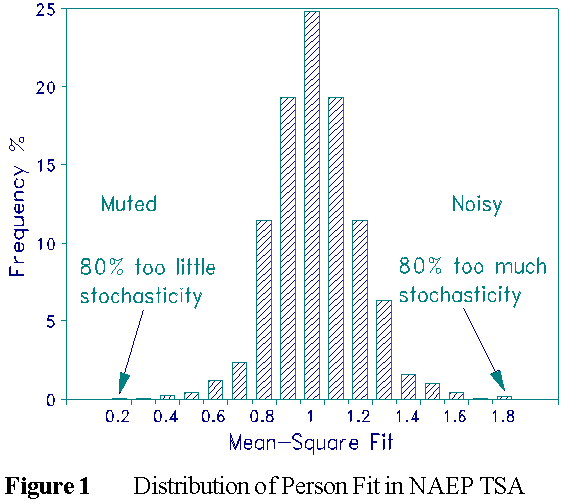
Rudner's INFIT mean-square distribution is reassuring for the NAEP Trial State Assessment (see Figure 1). Its mean is 0.97, standard deviation .17. But the tails, though statistically acceptable invite investigation. Rudner's other two Figures show how unwanted examinee behavior is indicated by the tails.

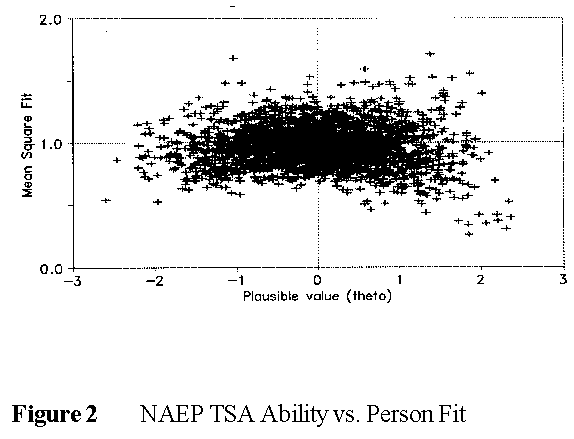
In Figure 2, high mean-squares indicate unexpected successes or failures. Unexpected responses by low performers are bound to be improbable successes. These could be due to special knowledge or lucky guessing. Unexpected responses by high performers are bound to be improbable failures. These could be due to carelessness, slipping, misunderstandings or "special ignorance". In Figure 2, in the upper right quadrant, there are many more persons misfitting because of careless errors (or incomplete response strings) than, in the upper left quadrant, persons benefiting from lucky guessing.

Low mean squares indicate less randomness in the response strings than modelled. This could indicate a curriculum effect, i.e., competence at everything taught against a test that also includes difficult, untaught material. Another possibility is the effect of a time limit. When data are taken to be complete, comprising equally determined efforts to succeed on each item, then a time limit makes the last items in a test appear harder. Slow, but careful, workers get all earlier items correct. This higher success rate on early items makes them appear easier. When time runs out these plodders "fail" the later items. The lower success rate on the later items makes them appear harder. This interaction between time and item difficulty makes response strings too predictable and lowers mean-squares below 1.0.
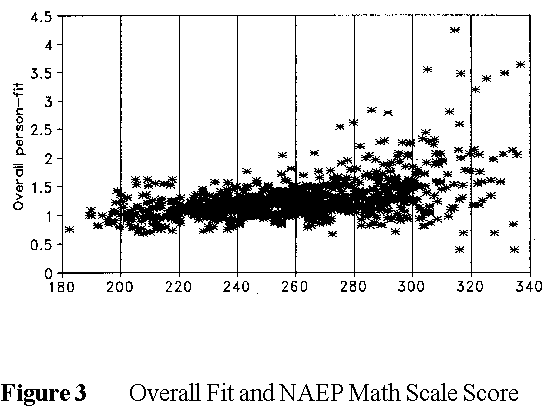
Figure 3 suggests an unexpected interaction between high ability and calculator use in the NAEP Mathematics test. 1990 was the first year that allowed calculators. Items involving calculators misfit. Perhaps high ability persons found calculators as much a liability as an asset, and so committed unexpected errors on items they would have got right by hand. Again there is an excess of unlucky errors over lucky guesses in Figure 3.

Although Rudner reports that trimming unexpected response strings has minimal impact on the overall NAEP conclusions, examining and diagnosing the response strings of such individuals enables us to evaluate and improve our tests, discover when and when not to trust test results, and identity those examinees who require special personal attention for instruction, guidance and decision making.
Guttman, L. 1950. The Basis for Scalogram Analysis. pp. 60-90 in Stouffer, S.A., et. al., Measurement and Prediction. New York: John Wiley, pp.76-77.
Rudner LM, Skagg G, Bracey G, Getson PR. 1995. Use of Person-Fit Statistics in Reporting and Analyzing National Assessment of Educational Progress Results. NCES 95-713. Washington DC: National Center for Education Statistics.
Smith, R.M. (1986) Person fit in the Rasch model. Educational and Psychological Measurement. 46(2) 359-372
Smith, R.M. (1991) The distributional properties of Rasch item fit statistics. Educational and Psychological Measurement. 51(3) 541-565.
Thurstone, L.L., Chave, E.J. 1929. The Measurement of Attitudes. Chicago: University of Chicago Press.
Wright, B.D. 1977. Solving Measurement Problems with the Rasch model. Journal of Educational Measurement, 14(2), 108.
Diagnosing person misfit. Rudner L, Wright BD. … Rasch Measurement Transactions, 1995, 9:2 p.430
| Forum | Rasch Measurement Forum to discuss any Rasch-related topic |
Go to Top of Page
Go to index of all Rasch Measurement Transactions
AERA members: Join the Rasch Measurement SIG and receive the printed version of RMT
Some back issues of RMT are available as bound volumes
Subscribe to Journal of Applied Measurement
Go to Institute for Objective Measurement Home Page. The Rasch Measurement SIG (AERA) thanks the Institute for Objective Measurement for inviting the publication of Rasch Measurement Transactions on the Institute's website, www.rasch.org.
| Coming Rasch-related Events | |
|---|---|
| Jan. 16 - Feb. 13, 2025, Fri.-Fri. | On-line workshop: Rasch Measurement - Core Topics (E. Smith, Winsteps), www.statistics.com |
| Apr. 8 - Apr. 11, 2026, Wed.-Sat. | National Council for Measurement in Education - Los Angeles, CA, ncme.org/events/2026-annual-meeting |
| Apr. 8 - Apr. 12, 2026, Wed.-Sun. | American Educational Research Association - Los Angeles, CA, www.aera.net/AERA2026 |
| May. 15 - June 12, 2026, Fri.-Fri. | On-line workshop: Rasch Measurement - Core Topics (E. Smith, Winsteps), www.statistics.com |
| June 19 - July 25, 2026, Fri.-Sat. | On-line workshop: Rasch Measurement - Further Topics (E. Smith, Winsteps), www.statistics.com |
The URL of this page is www.rasch.org/rmt/rmt92h.htm
Website: www.rasch.org/rmt/contents.htm