Choosing Sample Distributions

Sample
distributions bear a paradoxical relationship to measurement. On the one
hand, they often simplify estimation or may even be required to make
estimation possible. On the other hand, surely my measure should not
depend on the distribution of the sample I happen to be measured with!
It is clearly preferable,whenever possible, to use estimation methods
that do not require person or item distributions to be specified.
The simplest sample distribution is the point distribution,
hypothesizing a fixed effect. Everyone is thought to have the same
amount of the attribute - but how much? Many attitude surveys are
conceptualized this way. See RMT 5:4 p. 188 for an example
using log-linear and one-facet logit-linear Rasch models.
When a population is thought to be represented by a central value, but
individuals differ from that value in innumerable ways, each constituting
a small amount, then the normal distribution is often chosen. ANOVA
techniques use the normal distribution implicitly, usually without any
type of fit test. The degree to which the normal distribution can
simplify estimation is seen in Cohen's PROX algorithm which obtains a
direct analytical solution in a situation that usually requires a
non-linear, iterative approach (RMT 8:3 p. 378). Marginal
maximum likelihood (MMLE) methods employ the normal distribution, sometimes to
simplify estimation, sometimes to make it possible. Thus, for the 2- and
3-parameter IRT methods, a normal (or other) distribution must always be
specified.
Some sample distributions are chosen strictly on their mathematical
properties regardless of the empirical sample distribution. If a global
test yields some degree of model-to-data fit, then the chosen
distribution is accepted as representing that sample distribution. Thus,
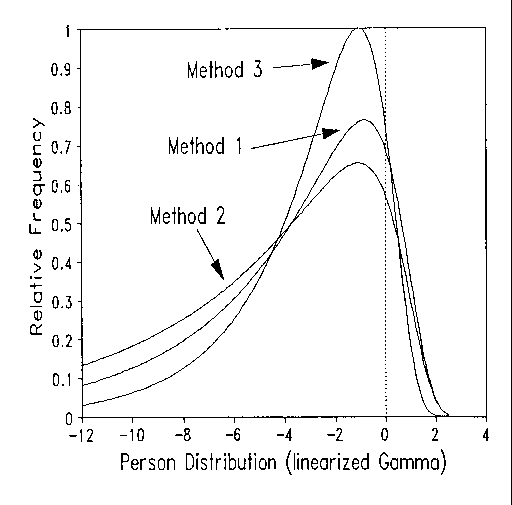
van Duijn and Jansen (1995) choose a gamma distribution for their
subjects and a Dirichlet distribution for their items, becausethese
produce a tractable marginal maximum likelihood estimation function for
theirPoisson count data. The Figure depicts the modeled ability
distributions of the pupils in their three reading-method groups.
Actual distributions can be skewed, squashed, lumpy,... Before
investing effort in the analysis or estimation of a particular
mathematical distribution function, it is wise to rough out histograms
of the person and item score distributions (on semi-loge paper if the data
are Poisson counts). Then make an informed choice of distribution. For
instance, if the data are seen to be multimodal, then a uniform
distribution is probably a better choice than a normal distribution (see
Wright & Stone's Best Test Design p. 145 ff. for
computer-free use of the uniform distribution). Once the computer has
printed estimates based on your selected distribution, it is hard to
admit to oneself that one has made a poor, or even misleading, choice of
distribution(See RMT 5:3 p.172 for an example of how easy it is
to convince oneself that a particular distribution's shape is
"correct").
John M. Linacre
Van Duijn M.A.J., Jansen M.G.H. (1995) Modeling repeated count data:
some extensions of the Rasch Poisson Counts model. Journal of
Educational and Behavioral Statistics 20:3, 241-258.
Linacre J.M. (1996) Choosing sample distributions. Rasch Measurement
Transactions 10:2 p. 503
Choosing sample distributions. Linacre J.M. … Rasch Measurement Transactions, 1996, 10:2 p. 503
