The widely-used item discrimination index reports the difference between the proportions of high and low scorers answering a dichotomous item correctly. High values are reputed to flag good items, low values bad.
Following the conventional approach, we extract from the sample G of persons two equal-sized subgroups, the high scorers UG (Upper group) and the low scorers LG (Lower group). Typically, following Kelley (1939), the distribution of persons is treated as normal and UG and LG are the upper and lower 27%. (For other sub-groupings, see Tristan, 1995.) Then the item discrimination index is d = p(UG) - p(LG), where p(UG) and p(LG) are the proportions of correct answers by UG and LG respectively. The maximum value of d, Max(d), is 1.0 and occurs when all the UG group succeed and all the LG group fail on an item.
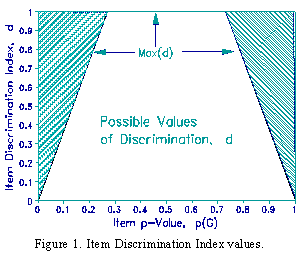
The easiness of an item for the whole sample is its p-value, p(G). This limits the value of Max(d). When 0.27 < p(G) < 0.73, i.e., when between 27% and 73% of the sample succeed, then the highest possible discrimination occurs when all the upper group succeed, i.e., p(UG) = 1.0, and all the lower group fail, i.e., p(LG) = 0, so that Max(d) = 1.0.
When p(G) < 0.27, then the item is most discriminating when p(LG)=0 and p(UG) = p(G)/0.27, so that Max(d) = p(G)/0.27. Similarly, when p(G) > 0.73, Max(d) = (1 - p(G))/.27. An item is not discriminating when p(LG) = p(UG) = p(G). Since negatively discriminating items contradict the test as a whole, they are eliminated. Figure 1 shows the possible values for d and p(G) for positively discriminating items.
Under Rasch model conditions, expected values of d can be estimated for different normally distributed samples of persons. Figure 2 is a nomograph of these values. For example, when the sample mean ability is 1.5 logits above the item, and the sample standard deviation is 2.0 logits (at arrow in Figure), the expected p-value is 0.72 and item discrimination index is 0.66. When data overfit the Rasch model, i.e., approach Guttman conditions, then d values will be higher than shown. When data are noisy, d values will be lower.
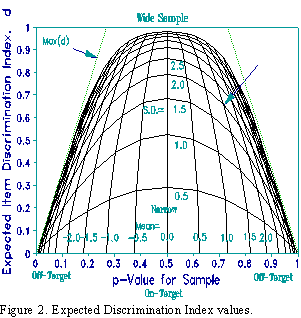
From the nomograph it can be seen that, when the sample is narrow or off-target, the expected item discrimination index is low, indicating that interpretation of these d values is always problematic. In fact, Rasch item discriminations (the slopes of the ogives) are the same for all samples, so these d values are descriptive of the samples, not the items. It is deviation from these d values that flag problem items.
Dr. Agustin Tristan Lopez
CENEVAL, Mexico
Kelley T.L. (1939) The selection of upper and lower groups for the validation of test items. Journal of Educational Psychology, 30, 17-24.
Tristan L.A. (1995) Model for computer-aided item analysis. (In Spanish). Foro Nacional de Evaluacion Educativa, Mexico: CENEVAL. pp. 45-68
Discrimination, Guessing and Carelessness Asymptotes: Estimating IRT Parameters with Rasch.
Linacre J.M. … Rasch Measurement Transactions, 2004, 18:1 p.959-960The Item Discrimination Index: Does it Work? Tristan Lopez A. … Rasch Measurement Transactions, 1998, 12:1 p. 626.
| Forum | Rasch Measurement Forum to discuss any Rasch-related topic |
Go to Top of Page
Go to index of all Rasch Measurement Transactions
AERA members: Join the Rasch Measurement SIG and receive the printed version of RMT
Some back issues of RMT are available as bound volumes
Subscribe to Journal of Applied Measurement
Go to Institute for Objective Measurement Home Page. The Rasch Measurement SIG (AERA) thanks the Institute for Objective Measurement for inviting the publication of Rasch Measurement Transactions on the Institute's website, www.rasch.org.
| Coming Rasch-related Events | |
|---|---|
| May. 15 - June 12, 2026, Fri.-Fri. | On-line workshop: Rasch Measurement - Core Topics (E. Smith, Winsteps), www.statistics.com |
| June 19 - July 25, 2026, Fri.-Sat. | On-line workshop: Rasch Measurement - Further Topics (E. Smith, Winsteps), www.statistics.com |
| Aug. 31 - Sept 2 2026, Mon.-Wed. | In person: IMEKO TC1 Metrology Education and Training symposium, Klagenfurt, Austria www.photomet-edumet2026.com. Submissions by April 20 |
| Aug. 30 - Sept. 3, 2027, Mon.-Fri. | In Person: 2027 IMEKO World Congress (TC1, Tc7, TC13, TC18, TC26), Rimini, Italy imeko2027.org |
The URL of this page is www.rasch.org/rmt/rmt121r.htm
Website: www.rasch.org/rmt/contents.htm