Item discrimination indicates the extent to which success on an item corresponds to success on the whole test. Since all items in a test are intended to cooperate to generate an overall test score, any item with negative or zero discrimination undermines the test. Positive item discrimination is generally productive, unless it is so high that the item merely repeats the information provided by other items on the test. This is the "attenuation paradox."
The Discrimination Index (D) is computed from equal-sized high and low scoring groups on the test. Subtract the number of successes by the low group on the item from the number of successes by the high group, and divide this difference by the size of a group. The range of this index is +1 to -1. Using Truman Kelley's "27% of sample" group size, values of 0.4 and above are regarded as high and less than 0.2 as low by R.L. Ebel (1954, Procedures for the Analysis of Classroom Tests, Educational and Psychological Measurement, 14, 352-364).
The Point-biserial Correlation is the Pearson correlation between responses to a particular item and scores on the total test (with or without that item). The Biserial Correlation models the responses to the item to represent stratification of a normal distribution and computes the correlation accordingly. Again the ranges are +1 to -1. The biserial is always more extreme than the point-biserial. Jm Nunnally (Psychometric Theory, 1967, p. 123) states that "to use the biserial is to paint a faulty picture of the actual size of the correlations obtainable from existing data." A convenient substitute for these correlations, particularly when data are missing, is the correlation between the Rasch person measures and their responses to the item, the point-measure correlation.
The 2-PL model parameterizes item discrimination in the model and uses it to estimate person ability. A 2-PL model can be written:
|
| (1) |
At its core, the estimation process is:

| (2) (3) |
Unconstrained, this produces a feed-back loop. In (2), success on highly discriminating items (Xni=1) raises the person measure, failure (Xni=0) lowers the person measure. In (3), success on an item by those with high measures, coupled with failure by those with low measures, raises the item discrimination. This raised discrimination then feeds back into (2) to increase the measure difference between the successful and unsuccessful, which then, in (3), increases the item discrimination, ad infinitum. To avoid this, 2-PL estimation programs introduce constraints such as a maximum limit on item discrimination estimates, and a pre-set person distribution. Rasch models have pre-set item discriminations in the model, so feedback does not occur. Person and item measures can be estimated in (2) because ai is set to 1 at this step. Then those measures can be used in (3) to estimate Rasch" item discriminations. There is no return to (2).

|
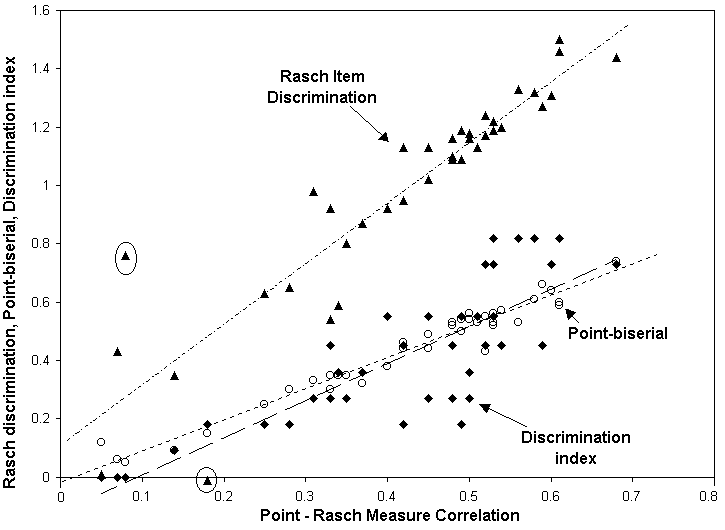
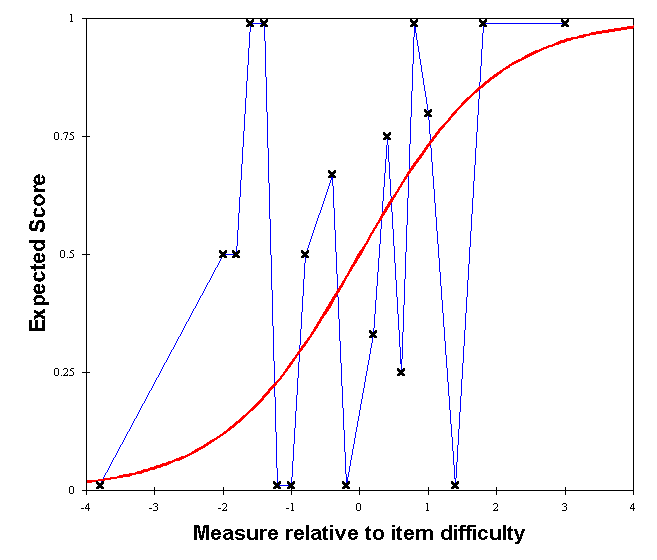
The plot shows the relationship between these indices. It reports item discrimination indices for dichotomous data reported in W J. Micheels and M. R. Karnes (1950, Measuring Educational Achievement, p. 478-9). For these data, the biserial correlations sometimes exceed 1, so that index is contra-indicated. The Discrimination Index (D) has been computed with the top 27% of the person sample in the high group and the bottom 27% in the low group. The trendlines (.... point-biserial, - - - discrimination index) show that all indices give similar information. The item ringed on left side of the plot has a low correlation but high Rasch item discrimination. It is an easy item with a few misfitting incorrect responses. The item ringed in the bottom left of the plot has negative Rasch discrimination. Its model and empirical ICCs are shown here. These results suggest that the point-measure or, for complete data, the point-biserial correlation capture the useful item discrimination information.
John M. Linacre
Note: the biserial correlation originated in Karl Pearson, "On a New Method of Determining Correlation ....", Biometrika, Vol. VII, pp. 96-105, 1909, and the point-biserial correlation originated in Richardson, M.W. & Stalnaker, J.M. (1933). "A note on the use of bi-serial r in test research". Journal of General Psychology, 8, 463-465.

|
| Item 31 (Micheels & Karnes) |
Discrimination, Guessing and Carelessness Asymptotes: Estimating IRT Parameters with Rasch.
Linacre J.M. … Rasch Measurement Transactions, 2004, 18:1 p.959-960Item Discrimination Indices. Kelley T., Ebel R., Linacre, JM. … Rasch Measurement Transactions, 2002, 16:3 p.883-4
| Forum | Rasch Measurement Forum to discuss any Rasch-related topic |
Go to Top of Page
Go to index of all Rasch Measurement Transactions
AERA members: Join the Rasch Measurement SIG and receive the printed version of RMT
Some back issues of RMT are available as bound volumes
Subscribe to Journal of Applied Measurement
Go to Institute for Objective Measurement Home Page. The Rasch Measurement SIG (AERA) thanks the Institute for Objective Measurement for inviting the publication of Rasch Measurement Transactions on the Institute's website, www.rasch.org.
| Coming Rasch-related Events | |
|---|---|
| Jan. 16 - Feb. 13, 2025, Fri.-Fri. | On-line workshop: Rasch Measurement - Core Topics (E. Smith, Winsteps), www.statistics.com |
| Apr. 8 - Apr. 11, 2026, Wed.-Sat. | National Council for Measurement in Education - Los Angeles, CA, ncme.org/events/2026-annual-meeting |
| Apr. 8 - Apr. 12, 2026, Wed.-Sun. | American Educational Research Association - Los Angeles, CA, www.aera.net/AERA2026 |
| May. 15 - June 12, 2026, Fri.-Fri. | On-line workshop: Rasch Measurement - Core Topics (E. Smith, Winsteps), www.statistics.com |
| June 19 - July 25, 2026, Fri.-Sat. | On-line workshop: Rasch Measurement - Further Topics (E. Smith, Winsteps), www.statistics.com |
The URL of this page is www.rasch.org/rmt/rmt163a.htm
Website: www.rasch.org/rmt/contents.htm