|
Separation or Strata? If the outliers in your sample of person or items follow a normal distribution, so that they can be considered to be accidental, then use Separation = G. If the outliers in your sample of person or items are heavy-tailed, so that they can be considered to represent extreme performance levels, then use Strata = H. |
Wright and Masters (Rating Scale Analysis, 1982, pp. 92, 106) write: "... if we define statistically distinct levels of item difficulty as difficulty strata with centers three calibration errors apart, then this separation index G can be translated into the number of item strata defined by the test H=..." (emphasis mine) and similarly for persons.
H = (4G + 1)/3
where G = Separation index = "True" standard deviation / Average measurement error
Note: in RUMM2020 documentation, the "Separation Index" is the reliability = G² / (1+G²).
David Andrich (1982) An Index of Person Separation in Latent Trait Theory, the Traditional KR-20 Index, and the Guttman Scale Response Pattern.
Education Research and Perspectives, 9:1, 95-104.
The "average measurement error" is the statistical average, i.e., the root-mean-square, of the standard errors of the measures of items of persons. The "True" standard deviation of the item or person measures is obtained from:
"True" standard deviation2 = Observed standard deviation2 - average measurement error2.
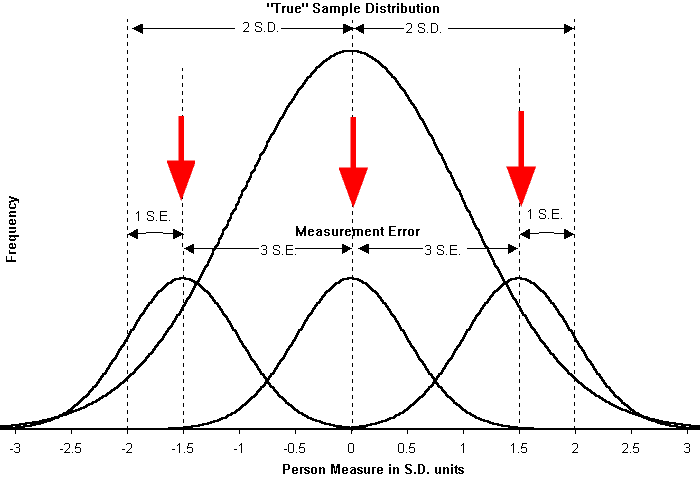
What does this mean? The plot shows the relationship between sample distribution and measurement error when H=3, i.e., when 3 strata are observed. This is when G=2, so that the "true" sample standard deviation, S.D., is twice the average measurement error, S.E. We see that the relevant range of the "true" distribution (assumed normal) is two standard deviations away from the mean, encompassing over 95% of the distribution. Compare this plot with the "Separation" plot in RMT 9:4.
| H=3 Three Statistical Strata |

|
Imagine that Person 1 is in the middle of strata 1 at location A with S.E. sized S. Person 2 is in the middle of strata 2 at location B with S.E. also sized S. The S.E.s are assumed the same for convenience (as in CTT). So their distance apart is (A-B) with S.E. sqrt(2)*S. The 2-sided 95% confidence interval for the distance (A-B) is 1.96*sqrt(2)*S = 2.77*S, so this is the distance between the middles of the strata.
The strata are defined as statistically distinct measures. In the "true" distribution, they are located 3 S.E. apart, because this is conveniently more than 1.96 * sqrt(2) = 2.77 S.E., the distance corresponding to .05 significance. The centers of the extreme strata are also positioned 1 S.E. within the boundaries of the sample distribution. Thus 84% of even the most extreme strata lie within the 4 S.D. range. In the observed distribution, the strata are located 3*S.E.*Observed S.D./True S.D. apart. The extreme strata are narrower. The strata are symmetric around the Observed mean.
G itself is a more conservative "Separation Index" than H. For instance, suppose that the "true" standard deviation of a sample is the same as the average measurement error. Then G=1, and the test reliability is 0.5, warning us that we don't know whether observed differences within the sample are real differences or merely measurement error. H is (4+1)/3, i.e., roughly 2. This indicates that the opposite ends of the "true" distribution are measurably different, implying that, if the observed measures are sufficiently far apart, they probably reflect real differences.
Number of Person or Item Strata: (4*Separation + 1)/3. Wright BD, Masters GN. … 2002, 16:3 p.888
Notes:
For H, the levels in the observed distribution are 12*"Observed S.D."/(3H - 1) apart, centered on the sample mean.
For G, the levels in the observed distribution are 3*"Observed S.D."/G apart, centered on the sample mean.
Number of Person or Item Strata. Wright BD, Masters GN. … Rasch Measurement Transactions, 2002, 16:3 p.888
| Forum | Rasch Measurement Forum to discuss any Rasch-related topic |
Go to Top of Page
Go to index of all Rasch Measurement Transactions
AERA members: Join the Rasch Measurement SIG and receive the printed version of RMT
Some back issues of RMT are available as bound volumes
Subscribe to Journal of Applied Measurement
Go to Institute for Objective Measurement Home Page. The Rasch Measurement SIG (AERA) thanks the Institute for Objective Measurement for inviting the publication of Rasch Measurement Transactions on the Institute's website, www.rasch.org.
| Coming Rasch-related Events | |
|---|---|
| Jan. 16 - Feb. 13, 2025, Fri.-Fri. | On-line workshop: Rasch Measurement - Core Topics (E. Smith, Winsteps), www.statistics.com |
| Apr. 8 - Apr. 11, 2026, Wed.-Sat. | National Council for Measurement in Education - Los Angeles, CA, ncme.org/events/2026-annual-meeting |
| Apr. 8 - Apr. 12, 2026, Wed.-Sun. | American Educational Research Association - Los Angeles, CA, www.aera.net/AERA2026 |
| May. 15 - June 12, 2026, Fri.-Fri. | On-line workshop: Rasch Measurement - Core Topics (E. Smith, Winsteps), www.statistics.com |
| June 19 - July 25, 2026, Fri.-Sat. | On-line workshop: Rasch Measurement - Further Topics (E. Smith, Winsteps), www.statistics.com |
The URL of this page is www.rasch.org/rmt/rmt163f.htm
Website: www.rasch.org/rmt/contents.htm