
|

|

|

|

|

|

|

|

|
The relationships among survey response rates, sample size, confidence intervals, reliability, and measurement error are often confused. Each of these are examined in turn, with an eye toward a systematic understanding of the role each plays in measurement. Reliability and precision estimates are of considerable utility, but their real cash value for practical applications is only rarely appreciated. This article aims to rectify confusions and provide practical guidance in the design and calibration of quality precision instruments.
Response Rates, Sample Size, and Statistical Confidence
First, contrary to the concerns of many consumers of survey data, response rates often have little to do with the validity or reliability of survey data.
To see why, consider the following contrast of two extreme examples. Imagine that 1,000 survey responses are obtained from 1,000 persons selected as demographically representative of a population of 1 million, for a 100% response rate. Also imagine that 1,000 responses from exactly the same people are obtained, but this time in response to surveys that were mailed to a representative cross-section of 100,000 possible respondents, for a 1% response rate.
In either case, with both the 100% and the 1% response rates, the sample of 1,000 provides a confidence interval of, at worst, 3.1%, at 95% confidence for a dichotomous proportion, e.g., in an opinion poll, 52% ± 3.1% prefer one political candidate to another. As long as the relevant demographics of the respondents (sex, age, ethnicity, etc.) are in the same proportions as they are in the population, and there is no self-selection bias, then the 1% response rate is as valid as the 100% response rate. This insight underlies all sampling methodology.
The primary importance of response rates, then, concerns the cost of obtaining a given confidence interval and of avoiding selection bias. If 1,000 representative responses can be obtained from 1,000 mailed surveys, the cost of the 3.1% confidence interval in the response data is 1% of what the same confidence interval would cost when 1,000 representative responses are obtained from 100,000 mailed surveys.
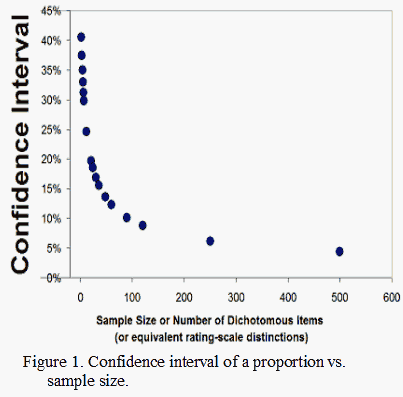
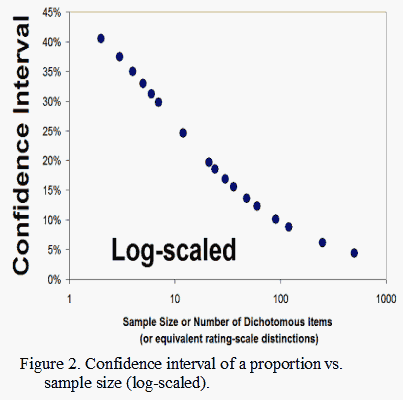
The statistical point is that, as shown in Figure 1, as sample size increases, the confidence interval for a dichotomous proportion decreases. Figure 2 shows that a nearly linear relationship between sample size and confidence interval is obtained when the sample size is expressed logarithmically-scaled. This relationship is a basic staple of statistical inference, but its role in the determination of measurement reliability is widely misunderstood.
Reliability and Sample Size
This same relationship with sample size is exhibited by reliability coefficients, such as KR-20 or Cronbach alpha. The relationship is complicated, however, by persistent confusions in the conceptualization of reliability.
In an article that is as relevant today as on the day it was published, Green, Lissitz, and Mulaik (1977; also see Hattie, 1985) show that "confusion in the literature between the concepts of internal consistency and homogeneity has led to a misuse of coefficient alpha as an index of item homogeneity." They "observed that though high 'internal consistency' as indexed by a high alpha results when a general factor runs through the items, this does not rule out obtaining high alpha when there is no general factor running through the test items" (Hattie, 1985, p. 144).
Green, et al. then "concluded that the chief defect of alpha as an index of dimensionality is its tendency to increase as the number of items increase" (Hattie, 1985, p. 144). Hattie (1985, p. 144) summarizes the state of affairs, saying that, "Unfortunately, there is no systematic relationship between the rank of a set of variables and how far alpha is below the true reliability. Alpha is not a monotonic function of unidimensionality."
The desire for some indication of reliability, as expressed in terms of precision or repeatably reproducible measures, is, of course, perfectly reasonable. But interpreting alpha and other reliability coefficients as an index of data consistency or homogeneity is missing the point. To test data for the consistency needed for meaningful measurement based in sufficient statistics, one must first explicitly formulate and state the desired relationships in a mathematical model, and then check the data for the extent to which it actually embodies those relationships. Model fit statistics (Smith, 2000) are typically employed for this purpose, not reliability coefficients.
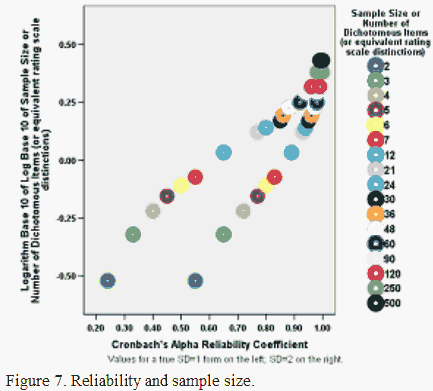
However, what Hattie, and Green, et al., characterize as the "chief defect" of coefficient alpha, "its tendency to increase as the number of items increase," has its productive place and positive purpose. This becomes apparent as one appreciates the extent to which the estimation of measurement and calibration errors in Rasch measurement is based in standard statistical sampling theory. The Spearman-Brown prophecy formula asserts a monotonic relationship between sample size and measurement reliability, expressed in the ratio of the error to the true standard deviation, as is illustrated in Linacre's (1993) Rasch generalizability nomograph.
Reliability and Confidence Intervals
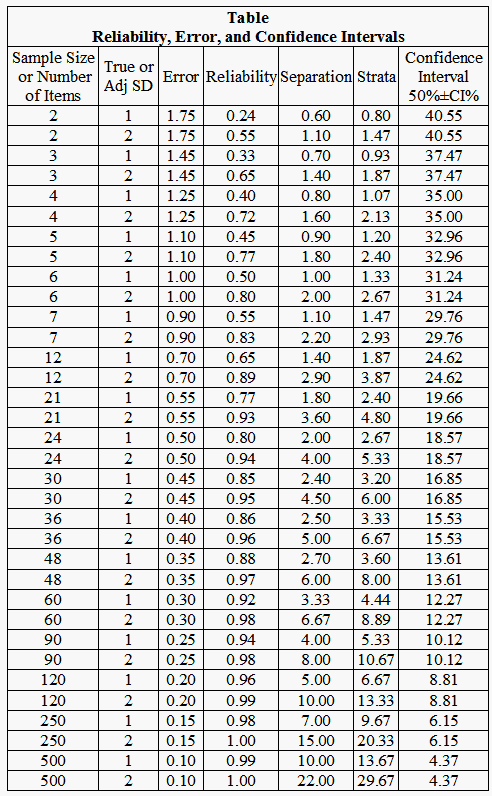
To illustrate this relationship, Rasch theory-based (model) errors and confidence intervals were obtained for a range of different test lengths (see Table). The modeled measurement errors associated with different numbers of dichotomous distinctions were read from Linacre's (1993) nomograph. The 95% confidence intervals for the raw score proportions produced from same numbers of items were found using the Wilson (1927) Score Interval .
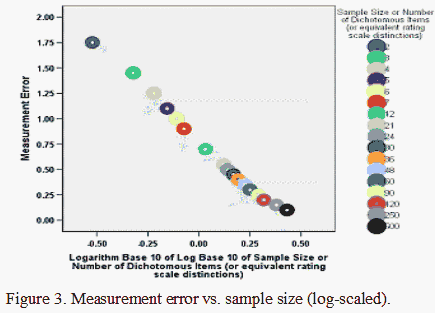
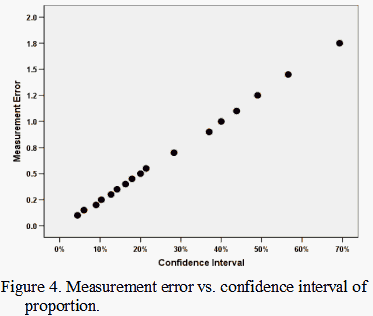
As already noted, Figures 1 and 2 show that the confidence intervals have a curvilinear relationship with the numbers of items/persons (or dichotomous distinctions). Figure 3 shows that Rasch error estimates have the same relationship with the counts as the confidence intervals. The confidence intervals and error estimates accordingly have a linear, one-to-one relationship, as shown in Figure 4, because they are both inversely proportional to the square-root of the person or item sample size for any given raw score percent.
The statistical frame of reference informing the interpretation of confidence intervals is, however, in direct opposition to the measurement frame of reference informing the interpretation of error estimates (Linacre, 2007). In statistical theory, confidence intervals and standard errors shrink for a given sample size as the response probability moves away from 0.50 toward either 0.00 or 1.00. That is, raw-score error is taken to be lowest at the extremes of the measurement continuum since there is little opportunity for extreme scores to vary.
In measurement theory, however, the association of internal consistency with statistical sufficiency reverses the situation. Now, as is shown in Linacre's (2007) figure, the error distribution is U-shaped instead of arched. This is because the consistent repetition of the unit of measurement across respondents and items gives us more confidence in the amounts indicated in the middle of the scale than they can at its extremes.
What this means is that the one-to-one correspondence of confidence intervals and error estimates shown in Figure 4 will hold only for any one response probability. As the probability of success or agreement, for instance, moves away from 0.50 (or as the difference between the measure and the calibration moves away from 0), the confidence interval will shrink while the Rasch measurement error will increase.
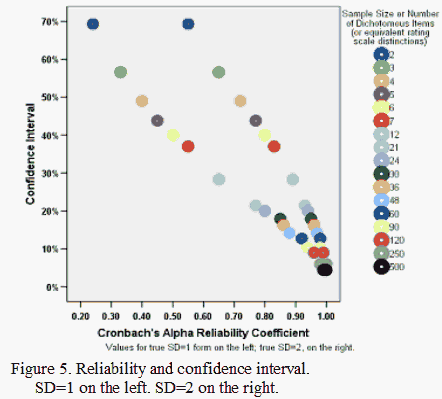
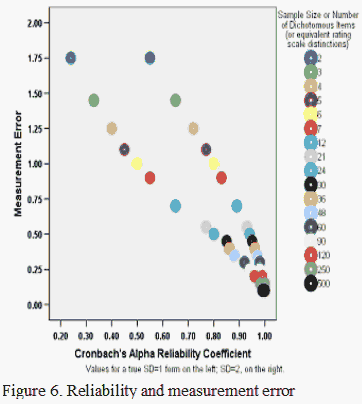
That said, plotting the errors and confidence intervals with Cronbach's alpha reveals the effect of the true standard deviation in the measures or calibrations on the numbers of items associated with various errors or confidence intervals (Figures 5 and 6). Again, as the number of items increases, alpha for the person sample increases, and the confidence intervals and errors decrease, all else being equal. Similarly when the number of persons increases, an equivalent to alpha for the items increases.
The point of these exercises is to bring home the cash value of reliably reproducible precision in measurement. Hattie (1985, pp. 143-4) points out that,
"In his description of alpha Cronbach (1951) proved (1) that alpha is the mean of all possible split-half coefficients, (2) that alpha is the value expected when two random samples of items from a pool like those in the given test are correlated, and (3) that alpha is a lower bound to the proportion of test variance attributable to common factors among the items."
This is why item estimates calibrated on separate samples correlate to about the mean of the scales' reliabilities, and why person estimates measured using different samples of items correlate to about the mean of the measures' reliabilities. (This statement is predicated on estimates of alpha that are based in the Rasch framework's individualized error terms. Alpha assumes a single standard error derived from that proportion of the variance not attributable to a common factor. It accordingly is insensitive to off-target measures that will inflate Rasch error estimates to values often considerably higher than the modeled expectation. This means that alpha can over-estimate reliability, and that Rasch reliabilities will often be more conservative. This is especially the case in the presence of large proportions of missing data. For more information, see Linacre (1996).)
That is, the practical utility of reliability and Rasch separation statistics is that they indicate how many ranges there are in the measurement continuum that are repeatedly reproducible (Fisher, 1992). When reliability is lower than about 0.60, the top measure cannot be statistically distinguished from the bottom one with any confidence. Two instruments each measuring the same thing with a 0.60 reliability will produce measures that correlate about 0.60, less well than individual height and weight correlate.
Conversely, as reliability increases, so does the number of ranges in the scale that can be confidently distinguished. Measures from two instruments with reliabilities of
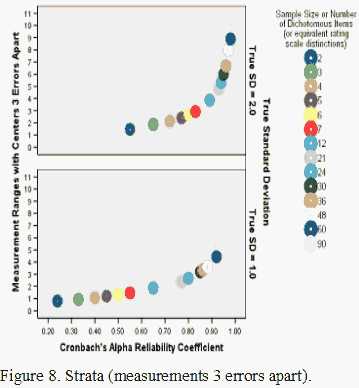
Figure 8 shows the theoretical relationship between strata (measurement or calibration ranges with centers three errors apart, Wright & Masters, 2002), Cronbach's alpha, and sample size or the number of dichotomous distinctions. High reliability, combined with satisfactory model fit, makes it possible to realize the goal of creating measures that not only stay put while your back is turned, but that stay put even when you change instruments!
William P. Fisher, Jr., Ph.D.
Avatar International LLC
Fisher, W. P., Jr. (1992). Reliability statistics. Rasch Measurement Transactions, 6(3), 238 www.rasch.org/rmt/rmt63i.htm
Green, S. B., Lissitz, R. W., & Mulaik, S. A. (1977, Winter). Limitations of coefficient alpha as an index of test unidimensionality. Educational and Psychological Measurement, 37(4), 827-833.
Hattie, J. (1985, June). Methodology review: Assessing unidimensionality of tests and items. Applied Psychological Measurement, 9(2), 139-64.
Linacre, J. M. (1993). Rasch-based generalizability theory. Rasch Measurement Transactions, 7(1), 283-284; www.rasch.org/rmt/rmt71h.htm
Linacre, J. M. (1996). True-score reliability or Rasch statistical validity? Rasch Measurement Transactions, 9(4), 455 www.rasch.org/rmt/rmt94a.htm
Linacre, J. M. (2007). Standard errors and reliabilities: Rasch and raw score. Rasch Measurement Transactions, 20(4), 1086 www.rasch.org/rmt/rmt204f.htm
Smith, R. M. (2000). Fit analysis in latent trait measurement models. Journal of Applied Measurement, 1(2), 199-218.
Wilson, E. B. (1927). Probable inference, the law of succession, and statistical inference. Journal of the American Statistical Association 22: 209-212.
Wright B.D. & Masters G.N. (2002). Number of Person or Item Strata (4G+1)/3. Rasch Measurement Transactions, 2002, 16:3 p.888 www.rasch.org/rmt/rmt163f.htm
The Cash Value of Reliability. Fisher, W.P., Jr. … Rasch Measurement Transactions, 2008, 22:1 p. 1160-3
| Forum | Rasch Measurement Forum to discuss any Rasch-related topic |
Go to Top of Page
Go to index of all Rasch Measurement Transactions
AERA members: Join the Rasch Measurement SIG and receive the printed version of RMT
Some back issues of RMT are available as bound volumes
Subscribe to Journal of Applied Measurement
Go to Institute for Objective Measurement Home Page. The Rasch Measurement SIG (AERA) thanks the Institute for Objective Measurement for inviting the publication of Rasch Measurement Transactions on the Institute's website, www.rasch.org.
| Coming Rasch-related Events | |
|---|---|
| Jan. 16 - Feb. 13, 2025, Fri.-Fri. | On-line workshop: Rasch Measurement - Core Topics (E. Smith, Winsteps), www.statistics.com |
| Apr. 8 - Apr. 11, 2026, Wed.-Sat. | National Council for Measurement in Education - Los Angeles, CA, ncme.org/events/2026-annual-meeting |
| Apr. 8 - Apr. 12, 2026, Wed.-Sun. | American Educational Research Association - Los Angeles, CA, www.aera.net/AERA2026 |
| May. 15 - June 12, 2026, Fri.-Fri. | On-line workshop: Rasch Measurement - Core Topics (E. Smith, Winsteps), www.statistics.com |
| June 19 - July 25, 2026, Fri.-Sat. | On-line workshop: Rasch Measurement - Further Topics (E. Smith, Winsteps), www.statistics.com |
The URL of this page is www.rasch.org/rmt/rmt221i.htm
Website: www.rasch.org/rmt/contents.htm