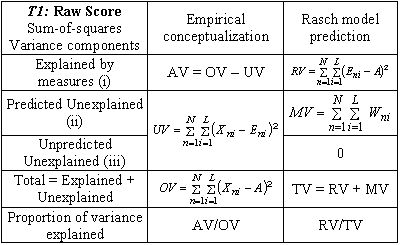
How much of the variance in my data do the Rasch measures explain? This is a crucial question, but its answer is far from obvious and can only be known approximately.
Here are three sources of variance in the data:
i) People differ in ability and items differ in difficulty. These cause different responses, and it is these differences that the Rasch measures are intended to reflect.
ii) People respond in an apparently random way, but still in accord with Rasch model predictions.
iii) People respond in a way that conflicts with Rasch model predictions.
Suppose that N people respond to L dichotomous items, scored 0,
1. The response by person n to item i is scored Xni
(using the notation of Wright & Masters, 1982, p. 100). Then the
overall average response, A, is
![]() .
.
So, conceptualizing the scored observations to be linear, as is
typically done, the observed variance sum-of-squares, OV, in the
data is
![]() .
.
This includes (i), (ii) and (iii) above.
Once the Rasch ability measures {Bn} and difficulty
measures {Di} have been estimated, there is an expected
value, Eni, for each Xni. The variance
explained by the Rasch measures, RV, can then be expressed as:
![]() corresponding to (i) above.
corresponding to (i) above.
Associated with each Eni is its Rasch-predicted model
variance Wni. Thus the variance not explained by the
measures, but predicted by the Rasch model, MV, is
![]() .
.
corresponding to (ii) above. The total variance in the data, TV,
is predicted to be
TV = RV + MV.
When the data fit the Rasch model, then OV = TV.
Empirically, the unexplained variance, UV, is
![]()
corresponding to (ii) + (iii) above. Then, since fit to the model
is never perfect, the variance actually explained, AV, a shown in
Table T1, becomes
AV = OV - UV.

|
These variance computations can be extended to allow for missing data and polytomies by adjusting the summations.
When the data approximate the Rasch model, the proportion of variance explained is about equal for the two conceptualizations. When the data grossly misfit the model, the empirical variance explained by the measures, AV, can become negative. On the other hand, with anchored measures, the empirically unexplained variance can become less than the Rasch predicted variance, indicating overfit of the current data to the measures. Tables T1 and T2 show the algebraic components and also their values for the "Liking for Science" data.
| T2: Raw Score Variance components in the "Liking for Science" data | Empirical conceptualization | Rasch model prediction |
|---|---|---|
| Explained by measures | AV = OV - UV = 564.63 | RV = 562.70 |
| Unexplained | UV = 543.92 | MV = 546.48 |
| Total = Explained + Unexplained | OV = 1108.55 | TV = RV + MV = 1109.18 |
| Proportion of variance explained | AV/OV = 51% | RV/TV = 51% |
Variance in Standardized Units
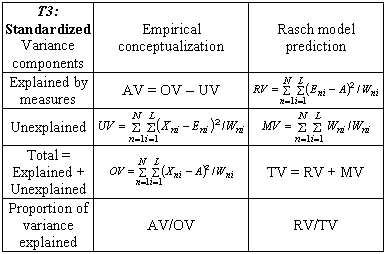
An alternative conceptualization is in standardized units. Here each response is modeled to contribute one unit of statistical information. Consequently, the summations are in unit normal deviates rather than in raw scores. This is summarized in Table T3.

|
| T4: Standardized Variance component in Winsteps Example 10A data | Empirical conceptualization | Rasch model prediction |
|---|---|---|
| Explained by measures | AV = OV - UV = 113.41 | RV = 220.04 |
| Unexplained | UV = 400.08 | MV = 240.00 |
| Total = Explained + Unexplained | OV = 513.49 | TV = RV + MV = 460.04 |
| Proportion of variance explained | AV/OV = 22% | RV/TV = 48% |
It is followed by Table T4, a practical example for data noticeably contradicting the Rasch model. In this example of an MCQ test, 4 of 20 items have negative point-biserial correlations, i.e., are oriented in opposition to the Rasch dimension. This has reduced the variance explained by the Rasch dimension to half what would be expected were these data to fit the model.
Relationship to Principal Components Analysis (pCA) of Residuals (PCAR)
The variance "explained by the measures" corresponds to the Rasch dimension. The "unexplained" variance corresponds to all other dimensions and random noise. PCAR attempts to partition the unexplained variance based on factors representing other dimensions. This is done by decomposing the matrix of inter-item (or inter-person) correlations of residuals. In this matrix, each diagonal element is set to 1, indicating that there is one unit of residual variance contributed by each item (or person). Thus the total amount of variance to be explained by the PCAR, i.e., the sum of the factor eigenvalues, equals the number of items (or persons).
The "unexplained" variances in the Tables are in summed raw score or standardized units with little immediate meaning, so it is convenient to rescale them into eigenvalue units such that the Unexplained variance corresponds to the sum of the eigenvalues to be explained by the PCAR. This is shown in Table T5 using the Liking for Science data comprising 25 items.
| T5: Standardized Variance Liking for Science |
Empirical Eigenvalue units |
|---|---|
| Total = Explained + Unexplained |
50.8 rescaled |
| Explained | 25.8 rescaled |
| Unexplained | 25.0 rescaled = PCAR |
| Explained by PCAR: 1st Factor 2nd Factor 3rd Factor |
4.3 eigenvalue 2.9 eigenvalue 2.3 eigenvalue |
The strength of the Rasch dimension, 25.8, can then be compared directly with the strength of the biggest secondary dimension, 4.3, indicating that, for most practical purposes, the Liking for Science data can be treated as unidimensional.
John M. Linacre
Data Variance: Explained, Modeled and Empirical, Linacre J.M. … Rasch Measurement Transactions, 2003, 17:3 p.942-943
| Forum | Rasch Measurement Forum to discuss any Rasch-related topic |
Go to Top of Page
Go to index of all Rasch Measurement Transactions
AERA members: Join the Rasch Measurement SIG and receive the printed version of RMT
Some back issues of RMT are available as bound volumes
Subscribe to Journal of Applied Measurement
Go to Institute for Objective Measurement Home Page. The Rasch Measurement SIG (AERA) thanks the Institute for Objective Measurement for inviting the publication of Rasch Measurement Transactions on the Institute's website, www.rasch.org.
| Coming Rasch-related Events | |
|---|---|
| Jan. 16 - Feb. 13, 2025, Fri.-Fri. | On-line workshop: Rasch Measurement - Core Topics (E. Smith, Winsteps), www.statistics.com |
| Apr. 8 - Apr. 11, 2026, Wed.-Sat. | National Council for Measurement in Education - Los Angeles, CA, ncme.org/events/2026-annual-meeting |
| Apr. 8 - Apr. 12, 2026, Wed.-Sun. | American Educational Research Association - Los Angeles, CA, www.aera.net/AERA2026 |
| May. 15 - June 12, 2026, Fri.-Fri. | On-line workshop: Rasch Measurement - Core Topics (E. Smith, Winsteps), www.statistics.com |
| June 19 - July 25, 2026, Fri.-Sat. | On-line workshop: Rasch Measurement - Further Topics (E. Smith, Winsteps), www.statistics.com |
The URL of this page is www.rasch.org/rmt/rmt173g.htm
Website: www.rasch.org/rmt/contents.htm