Data Variance Explained by Rasch Measures
The Rasch model predicts that each observation will contain an exactly predictable part generated by the Rasch measures, and a well-behaved random component whose variance is also predicted by the model.
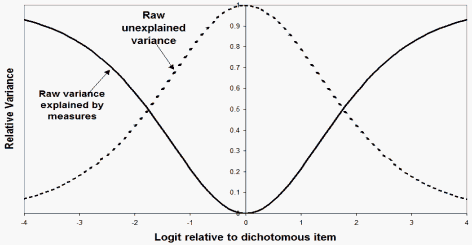
Figure 1 shows that, for dichotomous observations, as the logit measure difference between the person and the item increases (x-axis), the variance explained by the measures also increases (solid line) and the unexplained variance decreases (dotted line). When an item is as difficult as a person is able (0 on the x-axis), the outcome is completely uncertain. It is like tossing a coin. None of the variance in the observation is explained by the Rasch measures.
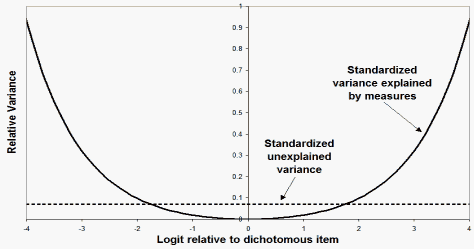
In Figure 2, the unexplained variance has been standardized to be the same size for every dichotomous observation. Thus each observation is modeled to contribute one unit of statistical information. An effect is to down-weight the central high-unexplained-variance observations. Standardized variances are used in the computation of standardized residuals which form the basis of several indicators of fit to the Rasch model.
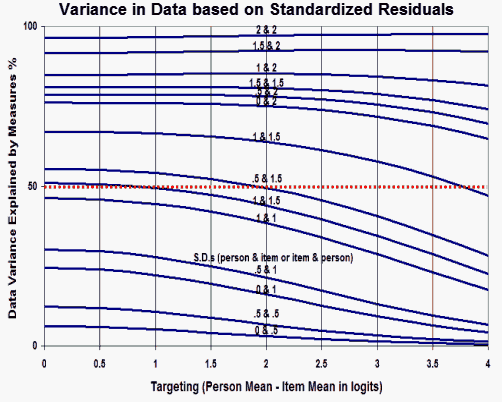
In Figure 3, the decomposition of the variance in the data is shown for different combinations of item and person variance and item-person targeting. The unexplained variance has been standardized across observations a in Fig. 2. It is seen that the sum of the person S.D. and item S.D. must exceed 2 logits in order that over 50% of the standardized variance in the data be explained by the Rasch measures.
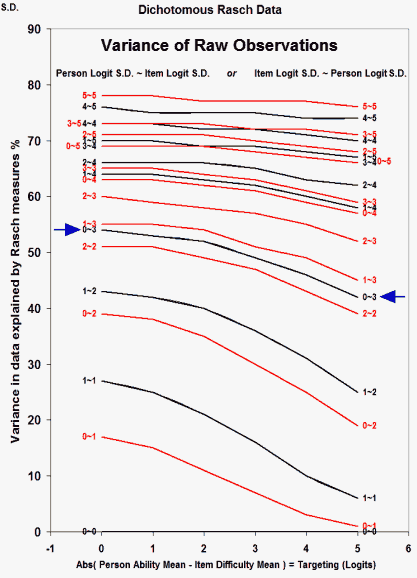
In the equivalent plot for variances using raw residuals [which have now been found to be a more accurate description], the y-axis values are about half of those plotted in Figure 3. Thus the sum of the person and item S.D.s must exceed 3 logits for over 50% of the raw observational variance to be explained.
John M. Linacre
For the expected size of the unexplained variance in the data, see www.rasch.org/rmt/rmt233f.htm.

Fig. 1.Variance decomposition of a dichotomy. |

Fig. 2. Decomposition with standardized variance. |

Fig. 3. Decompositions of item and person variance using standardized residuals |

Fig. 4. Decompositions of variance using raw residuals have their explained-values about halved relative to standardized residuals.
This graph from RMT 22:1 p. 1164.
|
- PCA: Data Variance: Explained, Modeled and Empirical
- Critical Eigenvalue Sizes (Variances) in Standardized Residual Principal Components Analysis (PCA)
- More about Critical Eigenvalue Sizes (Variances) in Standardized-Residual Principal Components Analysis (PCA)
- Data Variance Explained by Rasch Measures
- PCA: Variance in Data Explained by Rasch Measures
Data Variance Explained by Measures, Linacre J.M. … Rasch Measurement Transactions, 2006, 20:1 p. 1045


